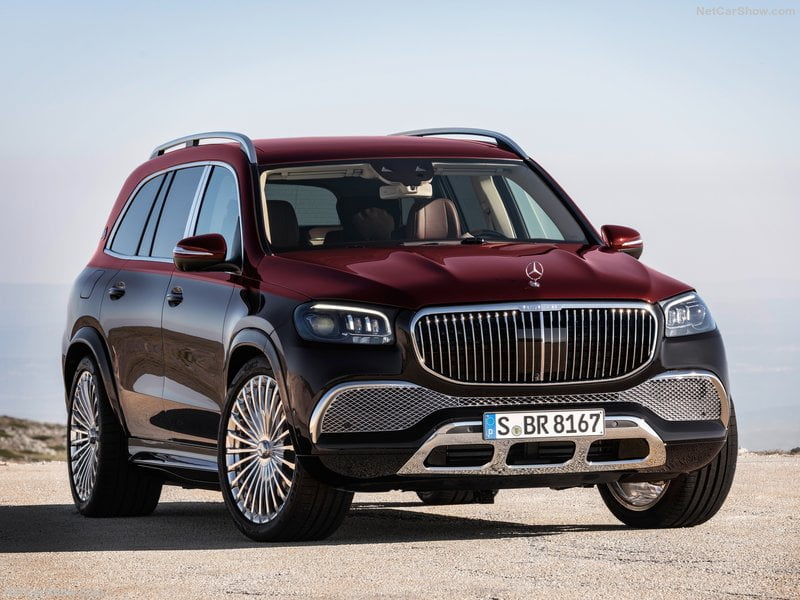
European Car Market in the 2019 will hit the best sales level in this decade with the sixth annual growth in a row. Volkswagen kept to be the leader, while standing over 1 point of share below the 2012 record. In second Renault, despite having lost share in favor of Dacia and in third Ford, while at the lowest share in the decade.
The European automotive industry has been on a successful trajectory and has ascended to be a global leader and driver of Europe’s growth and prosperity. Both the passenger car – as a cornerstone for individual mobility – and the commercial vehicle – as the backbone of the European economy – contribute tremendously to society, environment, economic welfare, and growth in Europe.
But while industry evolutions in the past served as accelerators to create an innovative economy, the European automotive industry is now at a tipping point.
The disruptive path ahead includes value pools shifting dramatically to new business models and present market leaders having to redefine their role in the newly created ecosystem, not least because their technological leadership is at risk in these new business models. In other words, the success story of the European automotive industry is challenged by the combination of two revolutionary forces that together are fundamentally changing the industry: the current momentum beyond the traditional set of players and regions, and disruptive megatrends.
While the future will be so challenging, the most recent data on new vehicles (cars + LCVs) registrations within Europe (EU28+Efta) are almost positive, considering that the 2018 was the highest sales year in the decade, with 18.86 million units registered and the 2019 is stable (-0.1%) considering the year to date figures, but is seen to be hitting the best sales level in this decade with the sixth annual growth in a row.
Volkswagen stands on top of the list with 11.4% of market share, 1.5 points below the best level hit in the 2012, while the second is Renault, with 7.7%, down 1.3 points from the best (in the 2010). We cannot avoid to consider that Renault brand has been partially cannibalized by the success of the low-price brand, Dacia, actually at 3.2% of share, the best ever, and up 1.5 points from the 2010.
In third place Ford with the lowest share in Europe ever, at 6.8%, down 1.6 points from the highest level in the decade (2010).
Service Solutions
Since 2010, focus2move.com is a specialist in the automotive industry tracking monthly sales for all brands and models in the widest in the World range of countries, actually over 150. From this huge database we can extract data sorted under your own conditions and deliver historical data in excel.
If you like to receive historical data or to subscribe at monthly update, contact us at kventura@focus2move.com and we will arrange a short video call. By showing you our database and segmentation, we can find together the best solutions for your team.
| Rank 2019 | Rank 2018 | Brand | Sales YTD 2019 | Sales November | '+/- YTD 2019 | Share YTD 2019 | Share November |
|---|---|---|---|---|---|---|---|
| 1 | 1 | Volkswagen | 1.634.492 | 148.869 | 0,1% | 11,1% | 12,3% |
| 2 | 2 | Renault | 967.799 | 79.104 | -5,4% | 6,6% | 6,5% |
| 3 | 3 | Ford | 923.342 | 77.148 | -2,7% | 6,3% | 6,4% |
| 4 | 4 | Peugeot | 905.390 | 75.355 | -0,4% | 6,2% | 6,2% |
| 5 | 6 | Mercedes | 884.766 | 76.375 | 8,6% | 6,0% | 6,3% |
| 6 | 5 | Opel | 784.992 | 52.250 | -5,3% | 5,4% | 4,3% |
| 7 | 7 | BMW | 751.135 | 69.032 | 0,4% | 5,1% | 5,7% |
| 8 | 8 | Skoda | 703.433 | 61.454 | 3,2% | 4,8% | 5,1% |
| 9 | 10 | Toyota | 690.792 | 57.335 | 2,9% | 4,7% | 4,7% |
| 10 | 9 | Audi | 686.108 | 53.414 | 0,8% | 4,7% | 4,4% |
| 11 | 12 | Citroen | 612.474 | 44.676 | 8,4% | 4,2% | 3,7% |
| 12 | 11 | Fiat | 590.517 | 44.233 | -10,2% | 4,0% | 3,6% |
| 13 | 14 | Dacia | 530.743 | 42.648 | 11,4% | 3,6% | 3,5% |
| 14 | 13 | Hyundai | 517.379 | 43.409 | 2,3% | 3,5% | 3,6% |
| 15 | 17 | Seat | 502.700 | 39.081 | 17,5% | 3,4% | 3,2% |
| 16 | 15 | Kia | 464.361 | 37.856 | -0,5% | 3,2% | 3,1% |
| 17 | 16 | Nissan | 364.987 | 28.034 | -22,0% | 2,5% | 2,3% |
| 18 | 18 | Volvo | 309.093 | 28.932 | 4,2% | 2,1% | 2,4% |
| 19 | 19 | Suzuki | 239.592 | 15.142 | 2,2% | 1,6% | 1,2% |
| 20 | 20 | Mazda | 227.954 | 23.520 | 3,9% | 1,6% | 1,9% |
| 21 | 21 | Mini | 197.149 | 16.542 | -0,7% | 1,3% | 1,4% |
| 22 | 22 | Jeep | 151.205 | 11.422 | -3,9% | 1,0% | 0,9% |
| 23 | 24 | Mitsubishi | 139.655 | 10.667 | 3,7% | 1,0% | 0,9% |
| 24 | 23 | Land Rover | 137.503 | 10.964 | -3,4% | 0,9% | 0,9% |
| 25 | 25 | Honda | 110.823 | 8.517 | -13,5% | 0,8% | 0,7% |
| 26 | 26 | Smart | 99.671 | 12.695 | 7,8% | 0,7% | 1,0% |
| 27 | 34 | Tesla | 84.382 | 8.680 | 281,5% | 0,6% | 0,7% |
| 29 | 29 | Porsche | 72.350 | 7.940 | 8,7% | 0,5% | 0,7% |
| 28 | 28 | Jaguar | 71.564 | 4.888 | -5,9% | 0,5% | 0,4% |
| 30 | 30 | Lancia | 54.820 | 4.320 | 24,0% | 0,4% | 0,4% |


