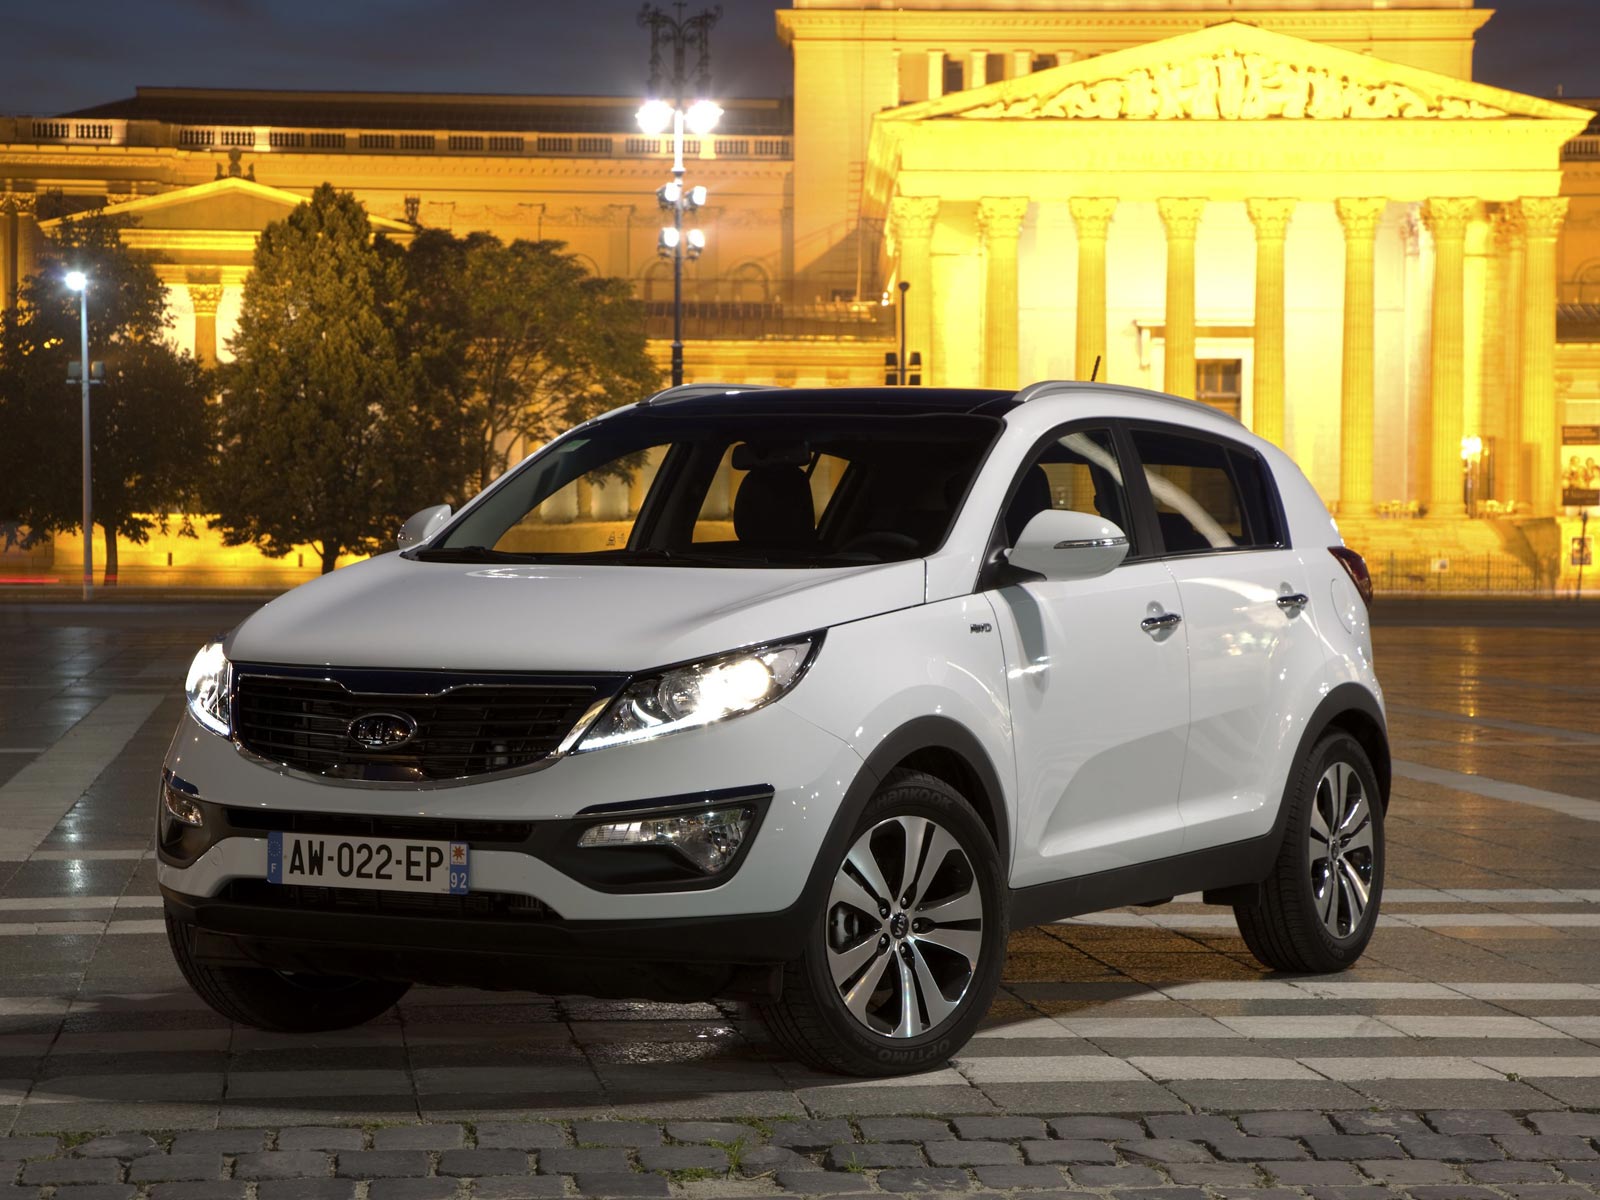
Syria Vehicles Market 2016 kept falling down losing an additional 44 percent and landing at a volume lower than one tenth compared with the 2010. In the harsh environment, just Koreans manufacturers survive.
Market Outlook
In addition to being a humanitarian nightmare, the on-going Syrian conflict has wreaked havoc on the country’s economy. Operating under the assumption that the conflict will continue on for “several more years,” a BMI Research release anticipates that the Syrian economy will contract by an average of 3.9% annually from 2016 to 2019. This will drag down the beleaguered economy to its early-1990s size.
In the horrible environment, automotive sector is struggling and sales are collapsing. In the 2016 sales at 7.833 units fell an additional 44.3%, with total volume now fallen below one tenth of the 2010 level.
Competitive Arena
In the 2016 there were only two carmakers selling significant volumes, Hyundai and Kia respectively with 4.690 units (-37.5%) and 4.137 (-35.4%). Nissan ranked third with 112 units (+19.1%).
The Kia Frontier was the new best selling model with 1.739 units (-35.2%), outpacing the Hyundai Elantra which was 2nd with 1.450 (-52.1%) and the Kia Sportage, third with 1.183 (-33.4%).
Below, you can sort our interactive tables to see data regarding Brands, Groups and Models. Please bear in mind that sales data are subject to adjustments as sources will update their information. This report is updated at the publishing date and will not be modified while the next on this subject will report year to date data updated.
| Rank Dec | Rank 2016 | BRAND | Sales December | Sales 2016 FY | Variation December | Variation 2016 FY | Share December | Share 2016 |
|---|---|---|---|---|---|---|---|---|
| 1 | 1 | Hyundai | 391 | 4.690 | -38,5% | -37,5% | 52,2% | 52,3% |
| 2 | 2 | Kia | 345 | 4.137 | -34,5% | -35,4% | 46,1% | 46,2% |
| 3 | 3 | Nissan | 10 | 112 | 0,0% | 19,1% | 1,3% | 1,2% |
| 4 | 4 | Subaru | 2 | 23 | 0,0% | -25,8% | 0,3% | 0,3% |
| 5 | 5 | Mazda | 1 | 1 | -50,0% | -97,1% | 0,1% | 0,0% |
| Rank Dec | Rank 2016 | GROUP | Sales December | Sales 2016 FY | Variation December | Variation 2016 FY | Share December | Share 2016 FY |
|---|---|---|---|---|---|---|---|---|
| 1 | 1 | Hyundai-Kia | 736 | 8.827 | -36,7% | -36,5% | 98,3% | 98,5% |
| 2 | 2 | Renault-Nissan | 10 | 112 | 0,0% | 19,1% | 1,3% | 1,2% |
| 3 | 3 | Fuji Heavy Industries | 2 | 23 | 0,0% | -25,8% | 0,3% | 0,3% |
| 4 | 4 | Mazda | 1 | 1 | -50,0% | -97,1% | 0,1% | 0,0% |
| Rank Dec | Rank 2016 | Model | Sales December | Sales 2016 | Variation December | Variation 2016 |
|---|---|---|---|---|---|---|
| 2 | 1 | Kia Frontier | 89 | 1.739 | -59,5% | -35,2% |
| 6 | 2 | Hyundai Elantra | 36 | 1.450 | -85,8% | -52,1% |
| 1 | 3 | Kia Sportage | 120 | 1.183 | -18,9% | -33,4% |
| 3 | 4 | Hyundai Tucson | 85 | 1.060 | -34,1% | -29,0% |
| 4 | 5 | Hyundai Santa fe | 80 | 1.039 | 60,0% | 83,2% |
| 5 | 6 | Kia Sorento | 40 | 595 | -27,3% | -3,4% |
| 7 | 7 | Kia Optima | 35 | 430 | 66,7% | 106,7% |
| 8 | 8 | Hyundai H-1 | 30 | 398 | -34,8% | -26,4% |
| 14 | 9 | Hyundai i10 | - | 198 | -100,0% | -69,6% |
| 9 | 10 | Kia Cerato | 20 | 130 | -23,1% | -59,8% |
| 10 | 11 | Hyundai H-1 Truck | 9 | 108 | -47,1% | -54,4% |
| 13 | 12 | Hyundai Accent | 1 | 102 | -98,6% | -88,2% |
| 11 | 13 | Kia Rio | 4 | 60 | -90,9% | -88,9% |
| 11 | 14 | Nissan Sunny | 4 | 41 | 0,0% | 10,8% |
| 11 | 15 | Nissan Patrol | 4 | 40 | ||
| 13 | 16 | Subaru Legacy | 1 | 23 | -50,0% | -20,7% |
| 14 | 17 | Nissan X-Trail | - | 21 | ||
| 12 | 18 | Hyundai Sonata | 2 | 16 | -81,8% | -85,5% |
| 13 | 19 | Hyundai Veloster | 1 | 14 | 133,3% |


