Italian best selling cars 2016 dominated for the fifth time in a row by the Fiat Panda, now entered in the global podium among the city cars. Renault Clio was the best imported vehicle.
The 2016 has been a really positive year for the automotive industry in Italy with the market back within the top 10 at global level.
The domestic models have benefit for the positive mood considering that near 30% of the market is in FCA hands.
For the fifth year in a row, the market leader was the city-car Fiat Panda with 147.283 sales (+16.5%), followed by the Lancia Ypsilon with 65.663 units (+17.6%) and the Fiat 500 L with 54.578 (+9.3%).
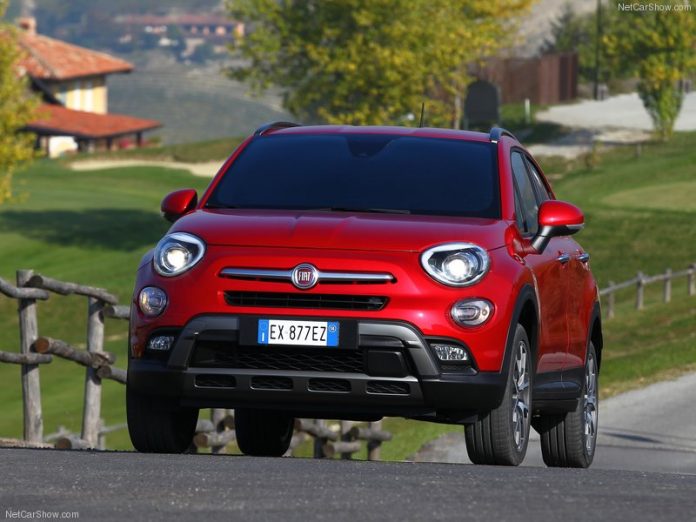
In fourth place and leader among imported vehicles, the Renault Clio with 49.798 units (+15.3%) ahead of the Volkswagen Golf, with 6.708 (+5.1%), the new Fiat 500X with 46.232 (+41.9%) units, the old Fiat 500 with 45.400 (+11.1%) and the Fiat Punto, down 6 spots with 45.208 units (-19.9%).
In ninth place the Ford Fiesta with 43.573 units (+8.2%) and in 10th place the Volkswagen Polo with 43.096 (+18.4%).
New models are raising with the just launched Fiat Tipo landed in 14th place with 31.555 sales, the Hyundai Tucson 22nd with 22.893 and the Renault Kadjar 32nd with 15.151.
Research, Consulting, Data & Forecast Store
F2M covers intensively this market with several products developed to help any investigation required.
Market Researches in PDF are immediately available for download with study on the market since 2005 and with forecast up to the 2022.
Auto Data in EXCEL are immediately downloadable with annual sales volume, split by month, for all brands and all models distributed in the market. This year data are released year to date, but you will receive a monthly update until the year-end.
All these and more within our Italy Store!
Below, you can sort our interactive tables to see data regarding Brands, Groups and Models. Please bear in mind that sales data are subject to adjustments as sources will update their information. This report is updated at the publishing date and will not be modified while the next on this subject will always have the year to date data updated.
| Rank 2016 | Rank 2015 | Best | Sales 2016 | Sales 2015 | Variation 2016 |
|---|---|---|---|---|---|
| 1 | 1 | Fiat Panda | 147.283 | 126.401 | 16,5% |
| 2 | 3 | Lancia Ypsilon | 65.663 | 55.826 | 17,6% |
| 3 | 4 | Fiat 500L | 54.578 | 49.918 | 9,3% |
| 4 | 6 | Renault Clio | 49.798 | 43.193 | 15,3% |
| 5 | 5 | Volkswagen Golf | 46.708 | 44.436 | 5,1% |
| 6 | 10 | Fiat 500x | 46.232 | 32.579 | 41,9% |
| 7 | 7 | Fiat 500 | 45.400 | 40.850 | 11,1% |
| 8 | 2 | Fiat Punto | 45.208 | 56.447 | -19,9% |
| 9 | 8 | Ford Fiesta | 43.573 | 40.275 | 8,2% |
| 10 | 9 | Volkswagen Polo | 43.096 | 36.384 | 18,4% |
| 11 | 14 | Peugeot 208 | 34.793 | 27.914 | 24,6% |
| 12 | 18 | Jeep Renegade | 34.331 | 23.096 | 48,6% |
| 13 | 11 | Toyota Yaris | 32.110 | 32.170 | -0,2% |
| 14 | 164 | Fiat Tipo | 31.555 | 751 | |
| 15 | 12 | Citroen C3 | 31.274 | 28.027 | 11,6% |
| 16 | 13 | Opel Corsa | 30.508 | 28.025 | 8,9% |
| 17 | 15 | Nissan Qashqai | 28.823 | 27.403 | 5,2% |
| 18 | 17 | Renault Captur | 28.255 | 23.931 | 18,1% |
| 19 | 19 | Alfa Romeo Giulietta | 23.831 | 22.921 | 4,0% |
| 20 | 16 | Opel Mokka | 23.799 | 24.712 | -3,7% |
| 21 | 21 | Peugeot 2008 | 23.369 | 20.333 | 14,9% |
| 22 | 75 | Hyundai Tucson | 22.893 | 5.633 | 306,4% |
| 23 | 20 | Dacia Duster | 22.370 | 20.918 | 6,9% |
| 24 | 23 | Dacia Sandero | 20.693 | 17.182 | 20,4% |
| 25 | 26 | Smart Fortwo | 19.477 | 15.837 | 23,0% |
| 26 | 22 | Peugeot 308 | 19.396 | 17.939 | 8,1% |
| 27 | 24 | Audi A3 | 17.837 | 17.151 | 4,0% |
| 28 | 34 | Ford Ecosport | 17.199 | 11.915 | 44,3% |
| 29 | 25 | Kia Sportage | 16.613 | 16.601 | 0,1% |
| 30 | 32 | Mercedes A Class | 16.349 | 12.854 | 27,2% |
| 31 | 50 | Volkswagen Tiguan | 15.400 | 8.485 | 81,5% |
| 32 | 91 | Renault Kadjar | 15.151 | 3.781 | 300,7% |
| 33 | 31 | Ford C-max | 14.399 | 13.070 | 10,2% |
| 34 | 27 | Ford Focus | 14.396 | 13.958 | 3,1% |
| 35 | 54 | Audi A4 | 14.067 | 8.107 | 73,5% |
| 36 | 28 | Toyota Aygo | 13.465 | 13.813 | -2,5% |
| 37 | 33 | Hyundai i10 | 13.440 | 12.495 | 7,6% |
| 38 | 44 | Opel Astra | 13.251 | 8.943 | 48,2% |
| 39 | 35 | Volkswagen Up! | 12.081 | 11.841 | 2,0% |
| 40 | 29 | Nissan Micra | 11.934 | 13.537 | -11,8% |
| 41 | 41 | Audi Q3 | 11.634 | 9.595 | 21,3% |
| 42 | 43 | Ford Kuga | 11.584 | 8.975 | 29,1% |
| 43 | 55 | Kia Rio | 11.542 | 8.055 | 43,3% |
| 44 | 39 | BMW 2 Series | 11.288 | 9.916 | 13,8% |
| 45 | 37 | Volkswagen Passat | 10.929 | 10.427 | 4,8% |
| 46 | 86 | BMW X1 | 10.841 | 4.087 | 165,3% |
| 47 | 36 | Hyundai i20 | 10.803 | 11.556 | -6,5% |
| 48 | 51 | BMW 3 Series | 10.397 | 8.437 | 23,2% |
| 49 | 38 | Toyota Auris | 10.328 | 10.094 | 2,3% |
| 50 | 30 | Mini Countryman | 10.083 | 13.097 | -23,0% |
| 51 | 77 | Opel Karl | 9.970 | 4.856 | 105,3% |
| 52 | 40 | Mini | 9.947 | 9.600 | 3,6% |
| 53 | 42 | Renault Twingo | 9.781 | 9.406 | 4,0% |
| 54 | 56 | Land Rover Range Rover Evoque | 9.768 | 7.778 | 25,6% |
| 55 | 73 | Suzuki Vitara | 9.598 | 5.797 | 65,6% |
| 56 | 69 | Renault Mégane | 9.567 | 6.390 | 49,7% |
| 57 | 47 | Mercedes B Class | 9.440 | 8.706 | 8,4% |
| 58 | 49 | Mercedes GLA | 9.078 | 8.601 | 5,5% |
| 58 | 57 | Citroen C4 | 9.078 | 7.716 | 17,7% |
| 59 | 52 | Smart Forfour | 8.893 | 8.282 | 7,4% |
| 60 | 53 | Mercedes C Class | 8.869 | 8.233 | 7,7% |
| 61 | 48 | Nissan Juke | 8.582 | 8.697 | -1,3% |
| 62 | 66 | BMW 1 Series | 8.552 | 7.188 | 19,0% |
| 63 | 46 | Ford B-Max | 8.458 | 8.724 | -3,0% |
| 64 | 59 | Citroen C1 | 8.170 | 7.537 | 8,4% |
| 65 | 65 | Skoda Octavia | 8.026 | 7.215 | 11,2% |
| 66 | 58 | Citroen C4 Cactus | 7.750 | 7.575 | 2,3% |
| 67 | 61 | Alfa Romeo MiTo | 7.542 | 7.458 | 1,1% |
| 68 | 64 | Peugeot 108 | 7.320 | 7.282 | 0,5% |
| 69 | 82 | Land Rover Discovery Sport | 7.179 | 4.444 | 61,5% |
| 70 | 70 | Toyota RAV4 | 6.948 | 6.132 | 13,3% |
| 71 | 63 | Audi A1 | 6.582 | 7.323 | -10,1% |
| 72 | 93 | Skoda Fabia | 6.304 | 3.580 | 76,1% |
| 73 | 72 | Hyundai ix20 | 6.271 | 5.894 | 6,4% |
| 74 | 60 | Opel Meriva | 6.254 | 7.492 | -16,5% |
| 75 | 68 | Opel Adam | 6.234 | 6.426 | -3,0% |
| 76 | 71 | Seat Leon | 6.057 | 5.962 | 1,6% |
| 77 | 76 | Seat Ibiza | 5.815 | 5.390 | 7,9% |
| 78 | 136 | Mercedes GLC | 5.806 | 1.380 | 320,7% |
| 79 | Mini Clubman | 5.415 | |||
| 80 | 101 | Kia Picanto | 5.307 | 2.979 | 78,1% |
| 81 | 62 | Ford KA | 5.213 | 7.417 | -29,7% |
| 82 | 83 | Audi A6 | 5.209 | 4.383 | 18,8% |
| 83 | 81 | Peugeot 3008 | 5.165 | 4.485 | 15,2% |
| 84 | 80 | Mercedes CLA | 5.094 | 4.680 | 8,8% |
| 85 | 79 | Volvo V40 | 5.019 | 4.784 | 4,9% |
| 86 | 89 | Nissan X-Trail | 5.001 | 3.848 | 30,0% |
| 87 | 100 | Volkswagen Touran | 4.736 | 3.055 | 55,0% |
| 88 | Alfa Romeo Giulia | 4.604 | |||
| 89 | 84 | Volvo XC60 | 4.270 | 4.210 | 1,4% |
| 90 | 78 | Audi Q5 | 4.208 | 4.839 | -13,0% |
| 91 | 87 | Kia Venga | 4.176 | 4.079 | 2,4% |
| 92 | 88 | BMW X3 | 4.056 | 4.006 | 1,2% |
| 93 | 127 | Mazda CX-3 | 4.015 | 1.799 | 123,2% |
| 94 | 97 | Abarth 595 | 3.872 | 3.267 | 18,5% |
| 95 | 95 | Suzuki Celerio | 3.853 | 3.390 | 13,7% |
| 96 | 85 | BMW 5 Series | 3.792 | 4.160 | -8,8% |
| 97 | 92 | Land Rover Range Rover Sport | 3.305 | 3.707 | -10,8% |
| 98 | 90 | Suzuki Swift | 3.261 | 3.816 | -14,5% |
| 99 | 67 | Renault Scénic | 3.258 | 6.587 | -50,5% |
| 100 | 94 | Jeep Cherokee | 3.246 | 3.451 | -5,9% |


