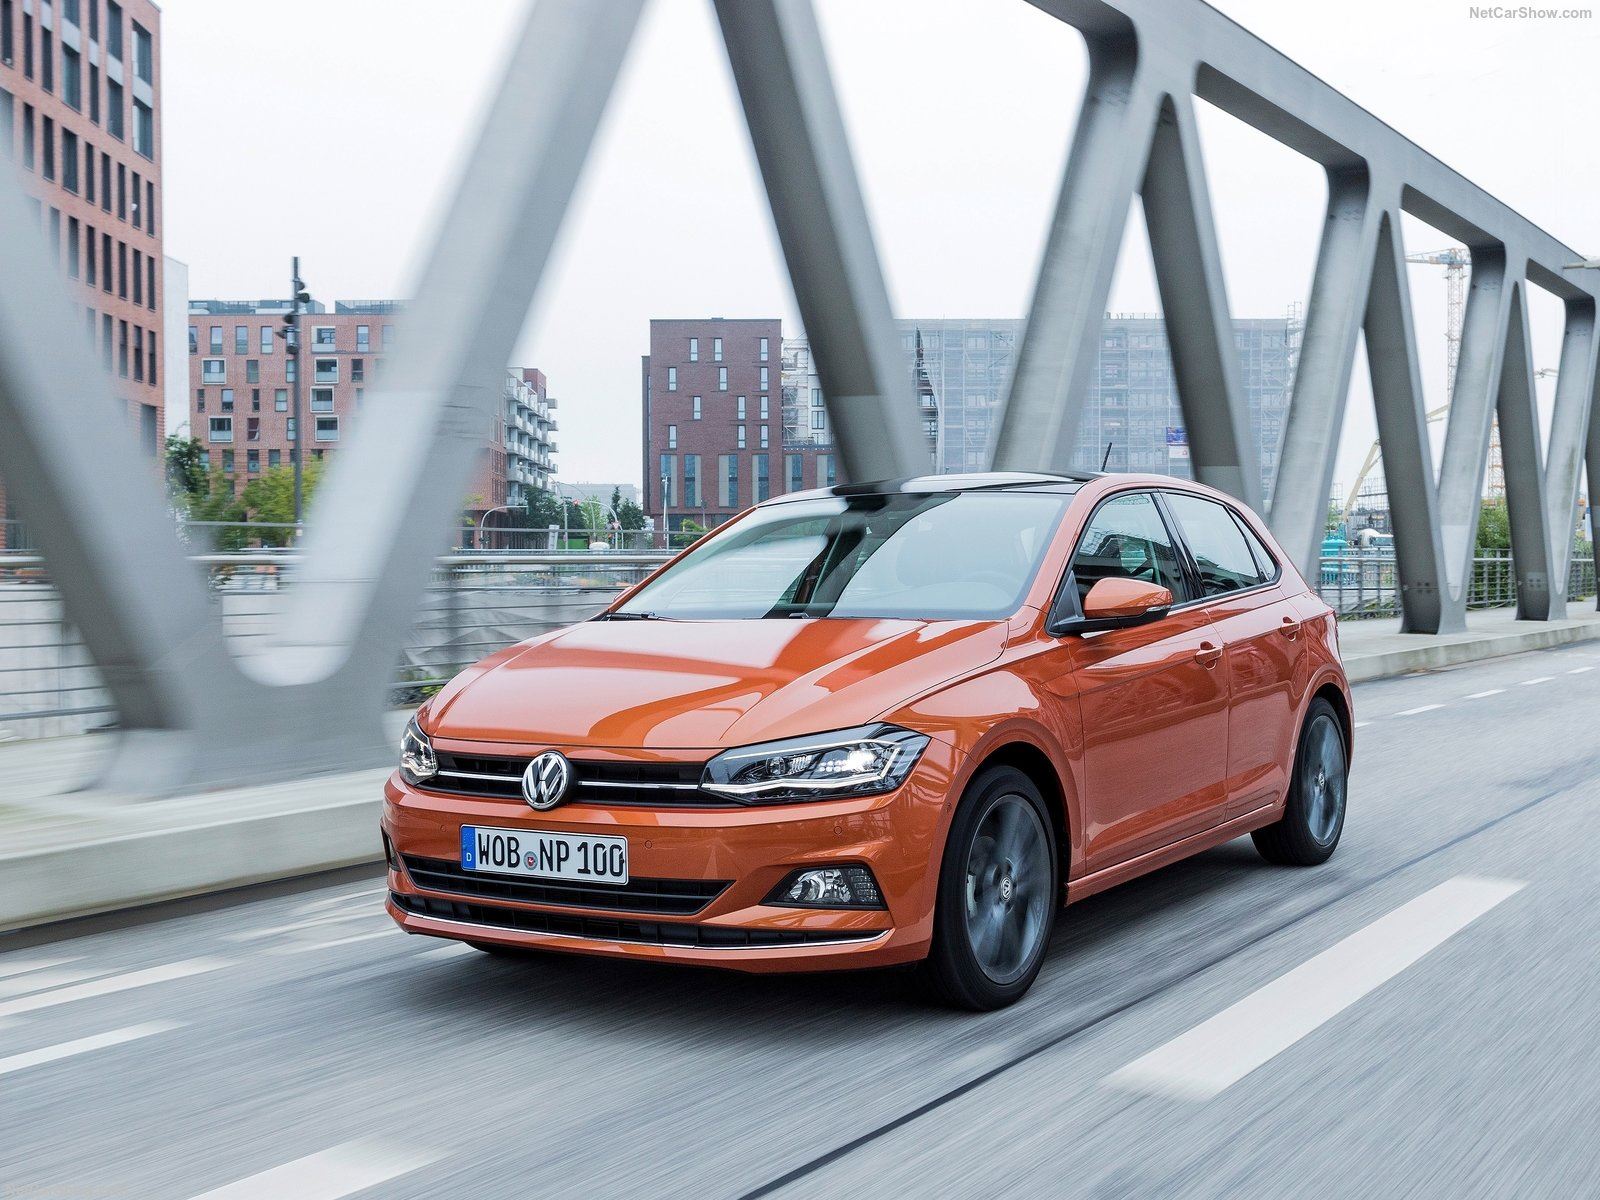
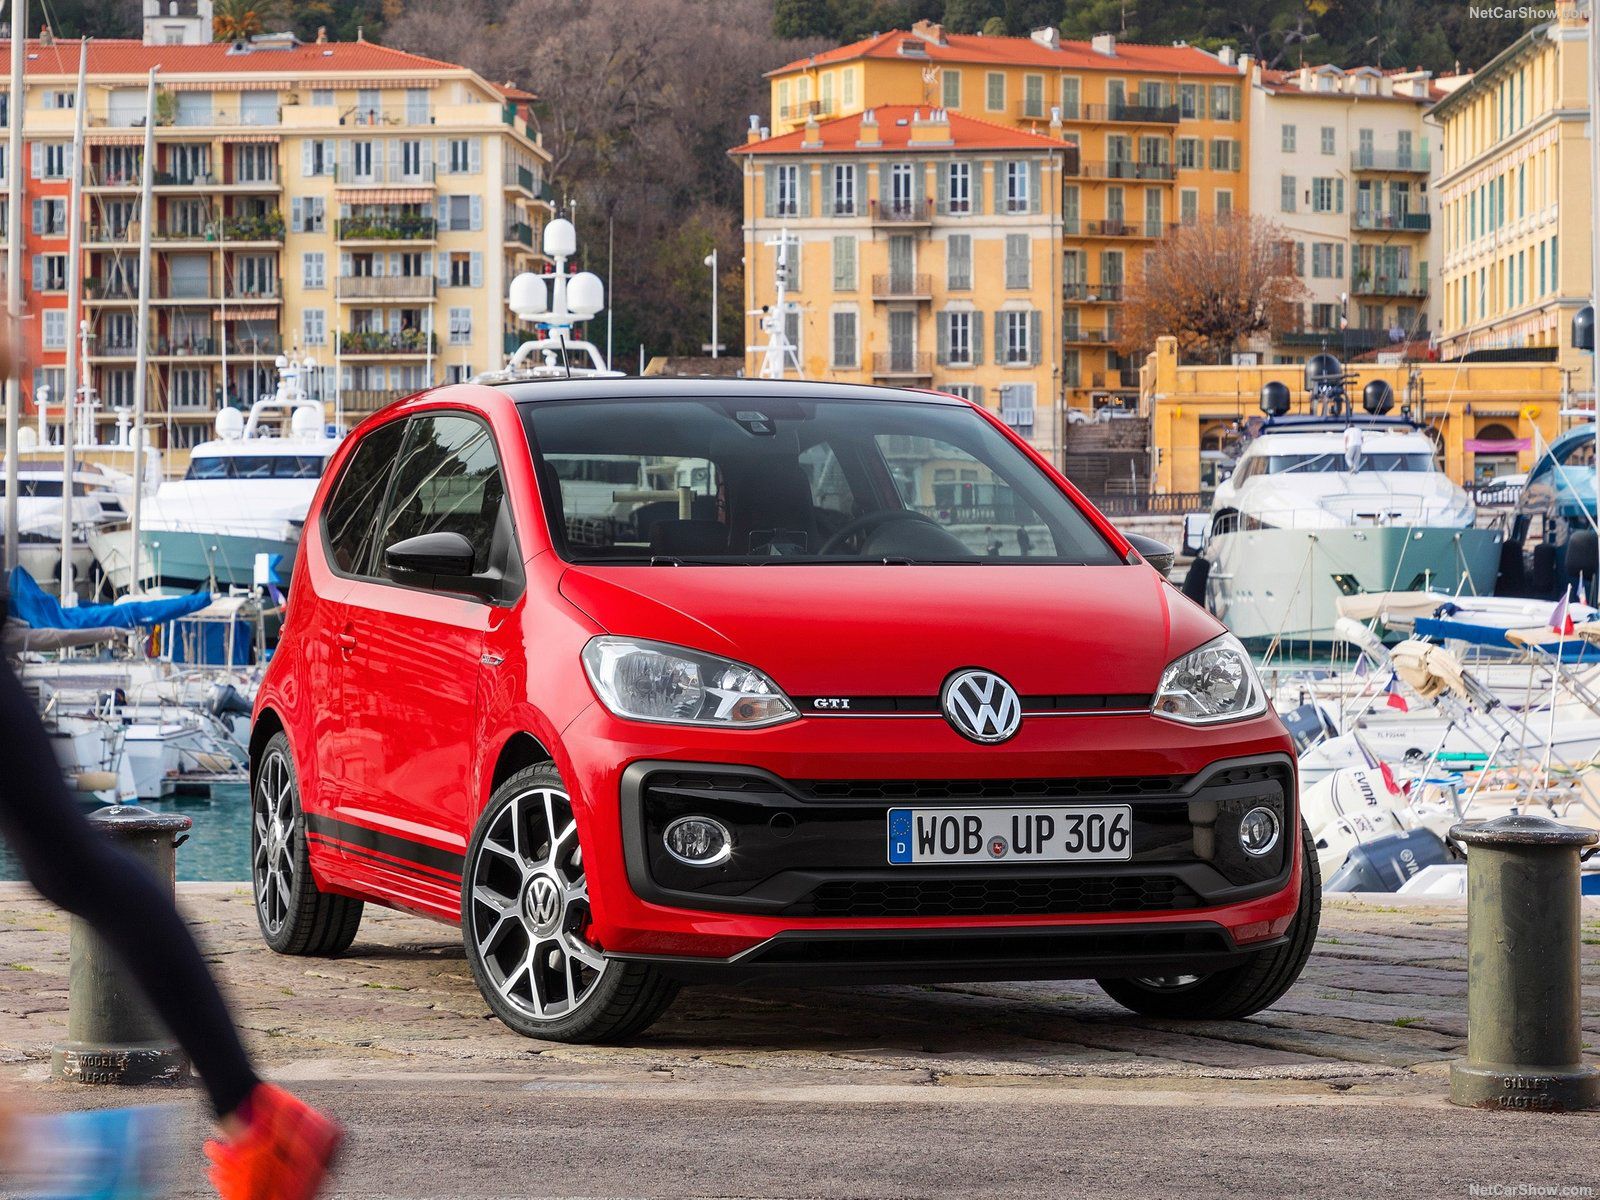
San Marino Auto sales in 2019 reported a negative trend. Indeed, the Full-year ended with registrations at 1.078, down 8.1% from 2018. Volkswagen kept leading for the 6th year in a row, followed by Suzuki and Audi, holding respectively 12.4% and 12.1% of share.
The new car passenger’s market in San Marino Republic in 2018 hit the best out of last six years, with 1.173 sales, up 0.6%.
However, in 2019 the market reported a negative performance. Indeed, according to data released by the San Marino Bureau of Statistics, the Full-year ended with registrations at 1.078, down 8.1% from 2018.
Volkswagen, which has been stable around 15-17% of share, led the market for the 6th year in a row, ahead of Suzuki with 12.4% and Audi with 12.1%.
| Rank 2019 | Rank 2018 | Brand | Sales 2019 | +/- YTD | Share 2019 |
|---|---|---|---|---|---|
| 1 | 1 | Volkswagen | 180 | -6,7% | 16,70% |
| 2 | 3 | Suzuki | 134 | 12,6% | 12,43% |
| 3 | 4 | Audi | 130 | 10,2% | 12,06% |
| 4 | 2 | Fiat | 68 | -48,1% | 6,31% |
| 5 | 7 | Renault | 53 | -3,6% | 4,92% |
| 6 | 5 | Toyota | 47 | -21,7% | 4,36% |
| 7 | 9 | Dacia | 41 | 5,1% | 3,80% |
| 8 | 10 | Mercedes | 37 | 2,8% | 3,43% |
| 9 | 8 | Opel | 36 | -10,0% | 3,34% |
| 10 | 9 | Ford | 34 | -12,8% | 3,15% |
| 11 | 14 | Citroen | 32 | 39,1% | 2,97% |
| 12 | 12 | BMW | 30 | -3,2% | 2,78% |
| 13 | 11 | Peugeot | 29 | -9,4% | 2,69% |
| 14 | 18 | Hyundai | 24 | 84,6% | 2,23% |
| 15 | 15 | Porsche | 23 | 9,5% | 2,13% |
| 15 | 6 | Jeep | 23 | -58,9% | 2,13% |
| 16 | 17 | Mazda | 21 | 50,0% | 1,95% |
| 17 | 14 | Land Rover | 18 | -21,7% | 1,67% |
| 18 | 16 | Mini | 17 | 13,3% | 1,58% |
| 19 | 13 | Kia | 15 | -40,0% | 1,39% |
| 20 | 19 | Volvo | 14 | 16,7% | 1,30% |
| 21 | 21 | Honda | 11 | 57,1% | 1,02% |
| 21 | 20 | Lancia | 11 | 10,0% | 1,02% |
| 22 | 21 | Jaguar | 9 | 28,6% | 0,83% |
| 22 | 19 | Alfa Romeo | 9 | -25,0% | 0,83% |
| 23 | 20 | Nissan | 7 | -30,0% | 0,65% |
| 24 | 18 | Smart | 6 | -53,8% | 0,56% |
| 25 | 25 | Subaru | 5 | 150,0% | 0,46% |
| 25 | 26 | Lexus | 5 | 400,0% | 0,46% |
| 26 | 24 | Seat | 4 | 33,3% | 0,37% |
| 27 | 23 | Mitsubishi | 2 | -60,0% | 0,19% |
| 27 | 22 | Maserati | 2 | -66,7% | 0,19% |
| 28 | 26 | Lamborghini | 1 | 0,0% | 0,09% |
| Rank 2019 | Rank 2018 | Group | Sales 2019 | Sales December | +/- 2019 | Share 2019 | Share December |
|---|---|---|---|---|---|---|---|
| 1 | 1 | Volkswagen Group | 338 | 28 | 0,6% | 31,35% | 31,11% |
| 2 | 3 | Suzuki | 134 | 11 | 12,6% | 12,43% | 12,22% |
| 3 | 2 | F.C.A. | 113 | 10 | -47,7% | 10,48% | 11,11% |
| 4 | 4 | Renault Nissan Alliance | 103 | 8 | -5,5% | 9,55% | 8,89% |
| 5 | 5 | P.S.A. | 97 | 8 | 2,1% | 9,00% | 8,89% |
| 6 | 6 | Toyota Group | 52 | 4 | -14,8% | 4,82% | 4,44% |
| 7 | 8 | BMW | 47 | 4 | 2,2% | 4,36% | 4,44% |
| 8 | 7 | Mercedes Daimler | 43 | 4 | -12,2% | 3,99% | 4,44% |
| 9 | 10 | Hyundai-Kia | 39 | 3 | 2,6% | 3,62% | 3,33% |
| 10 | 9 | Ford Group | 34 | 3 | -12,8% | 3,15% | 3,33% |


