Lesotho vehicles market in 2020 reports a drop as the pandemic influences sales. Indeed, 449 units were sold Year To Date August, losing 19% compared to last year. Toyota (-24.1%) maintains the leadership by a very large margin.
Economic Environment
Lesotho is a small and mountainous country completely landlocked by South Africa, depending on a narrow economic base of textile manufacturing, agriculture, remittances, and regional customs revenue.
About three-fourths of the people live in rural areas and engage in animal herding and subsistence agriculture, although Lesotho produces less than 20% of the nation’s demand for food. Agriculture is vulnerable to weather and climate variability.
Lesotho relies on South Africa for much of its economic activity; Lesotho imports 90% of the goods it consumes from South Africa, including most agricultural inputs.
Market Trend Year To Date
In Lesotho 449 units have been sold until August 2020, reporting a loss of 19% compared to last year. This negative trend in the market reflects the impact of the pandemic in the region, where infections started growing again exponentially in June.
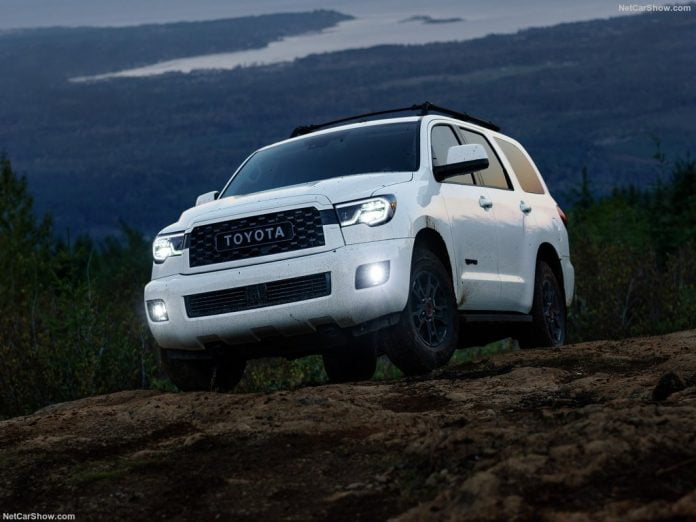
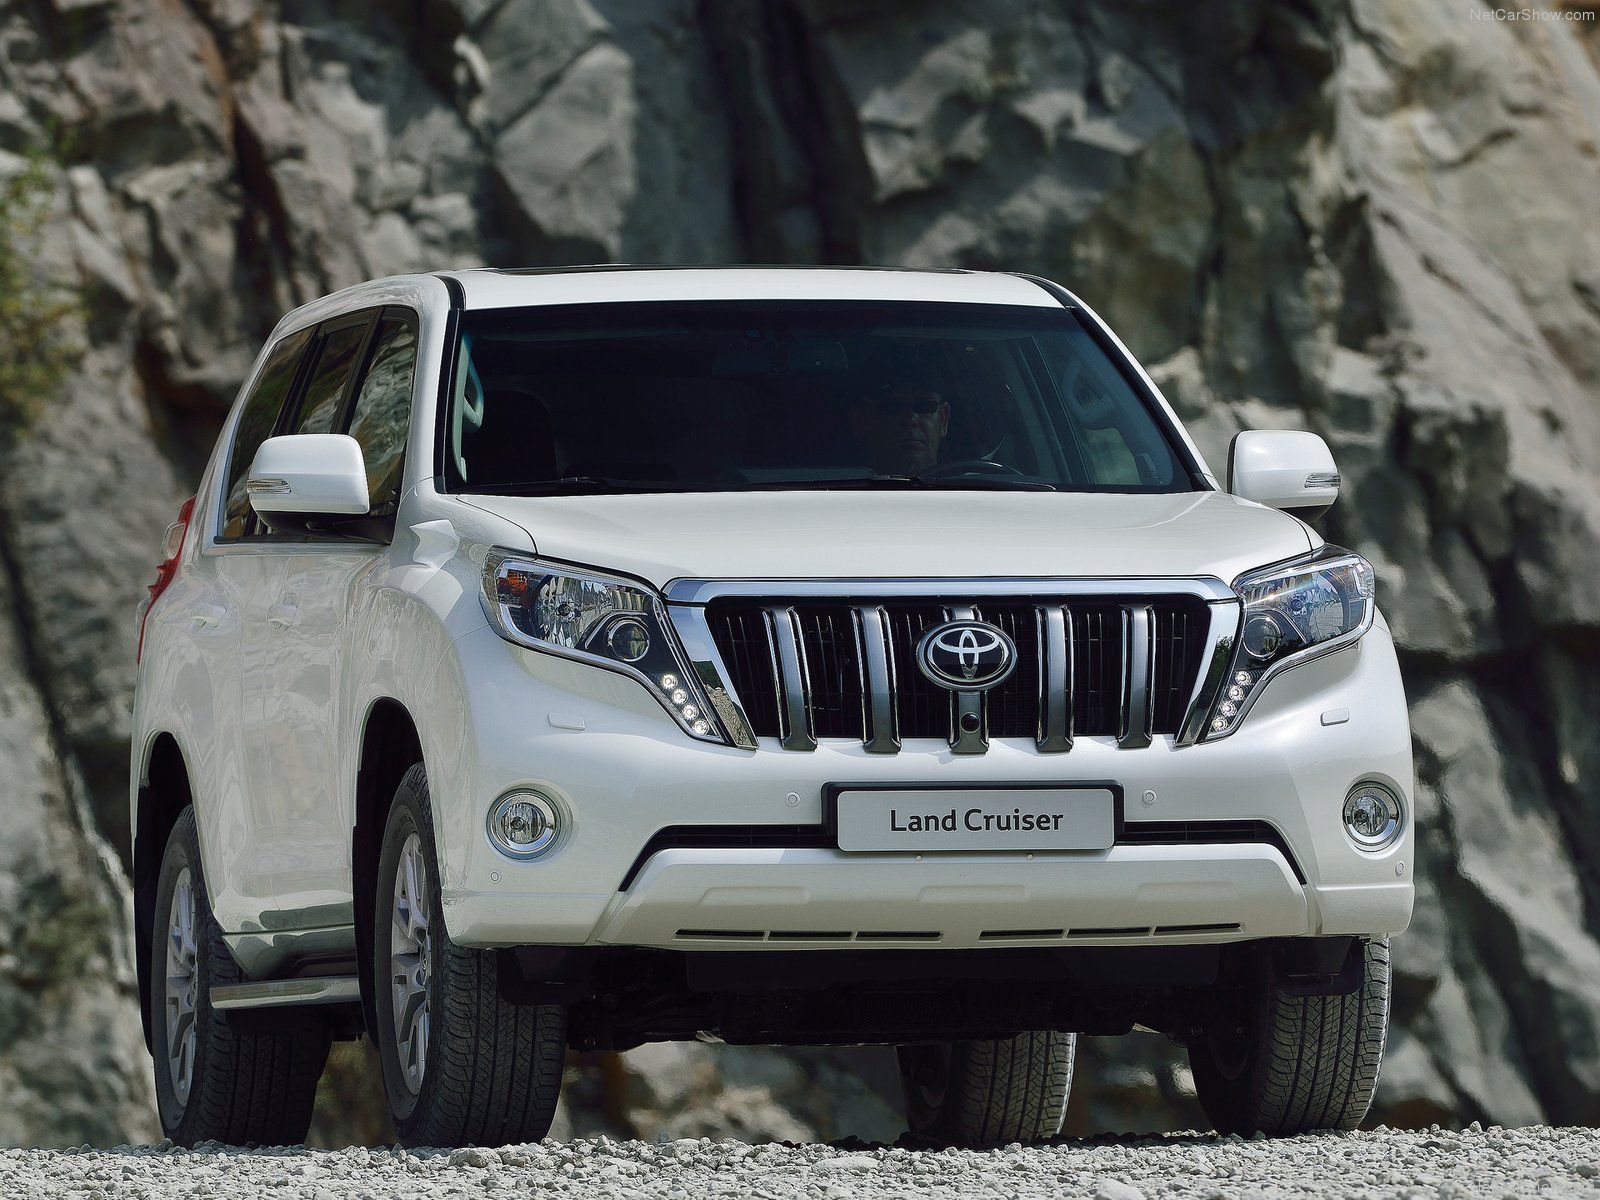
Brand-wise, Toyota remains the leader by a very large margin, even with a loss of 24.1%, followed by Isuzu, losing 28.9%, and by Nissan, losing 25.6%. The top 10 gainer was Land Rover, with a 1000% increase in sales, while the worst performance was achieved by Volvo, losing 80%.
Medium Terms Market Trend
Lesotho cars market is largely based on used vehicles imported by South Africa with a very limited offer of new vehicles cars, addressed to the few private consumers able to sustain their cost and to the public sector.
In recent years the new vehicles market was stable below 1.000 units. After having registered a peak of 935 units in 2014, the declined two years in a row. However, in 2017 sales immediately recovered – improving 19% – with 737 units sold.
In 2018, the market kept the previous year’s trend. Indeed, the year ended with 881 sales, growing 20%. In 2019 836 units were sold, a 5% decrease compared to the previous year.
In Q1 2020 201 units were sold, a 7.4% decrease compared to last year. Subsequently, in the First Half of the year, the market was hit by the COVID-19 pandemic, leading First Half figures to 295 units with a loss of 29.4%.
Tables with sales figures
In the tables below we report sales for the Top 10 Brands


