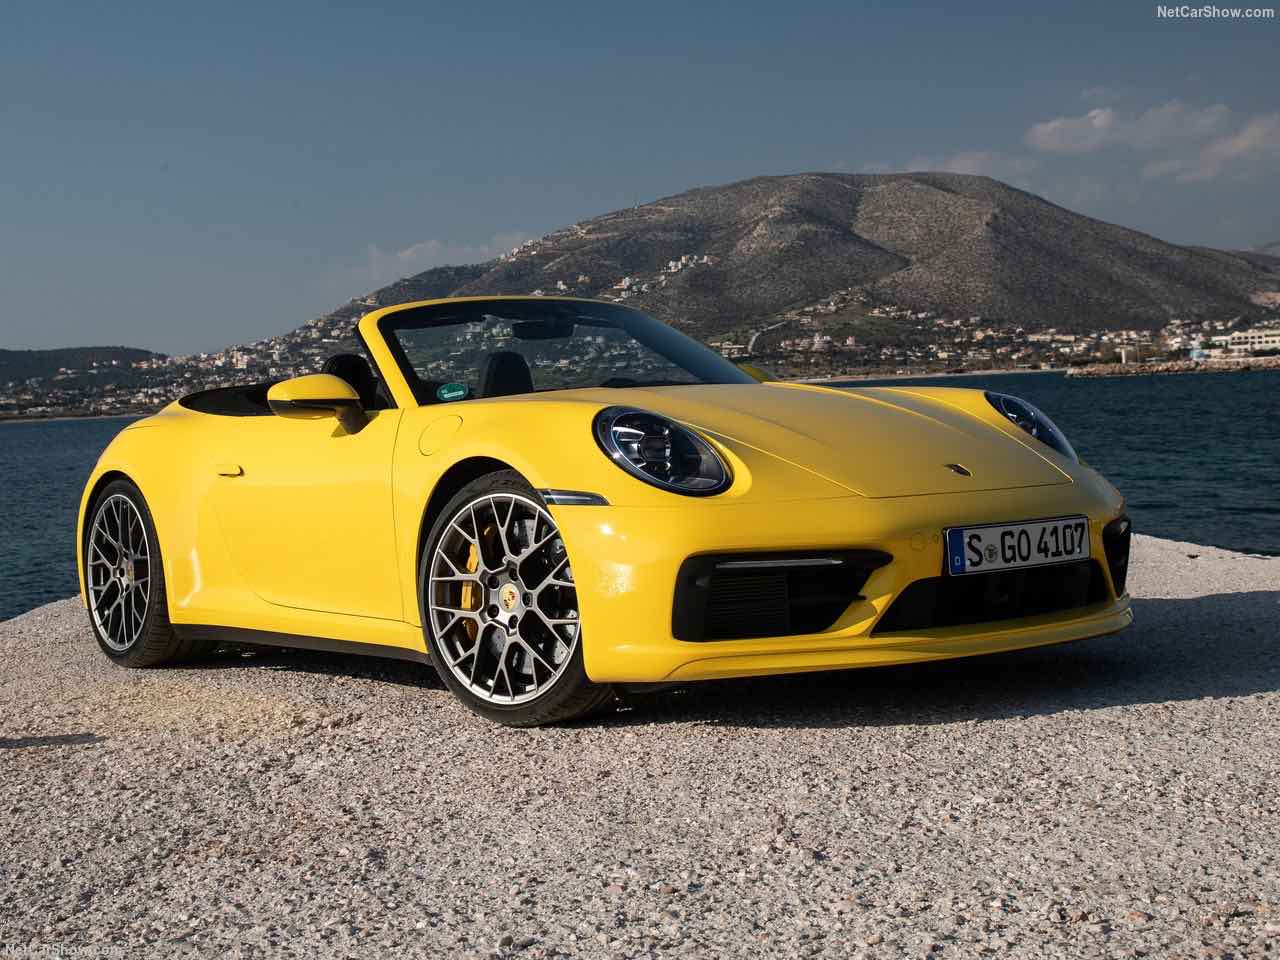
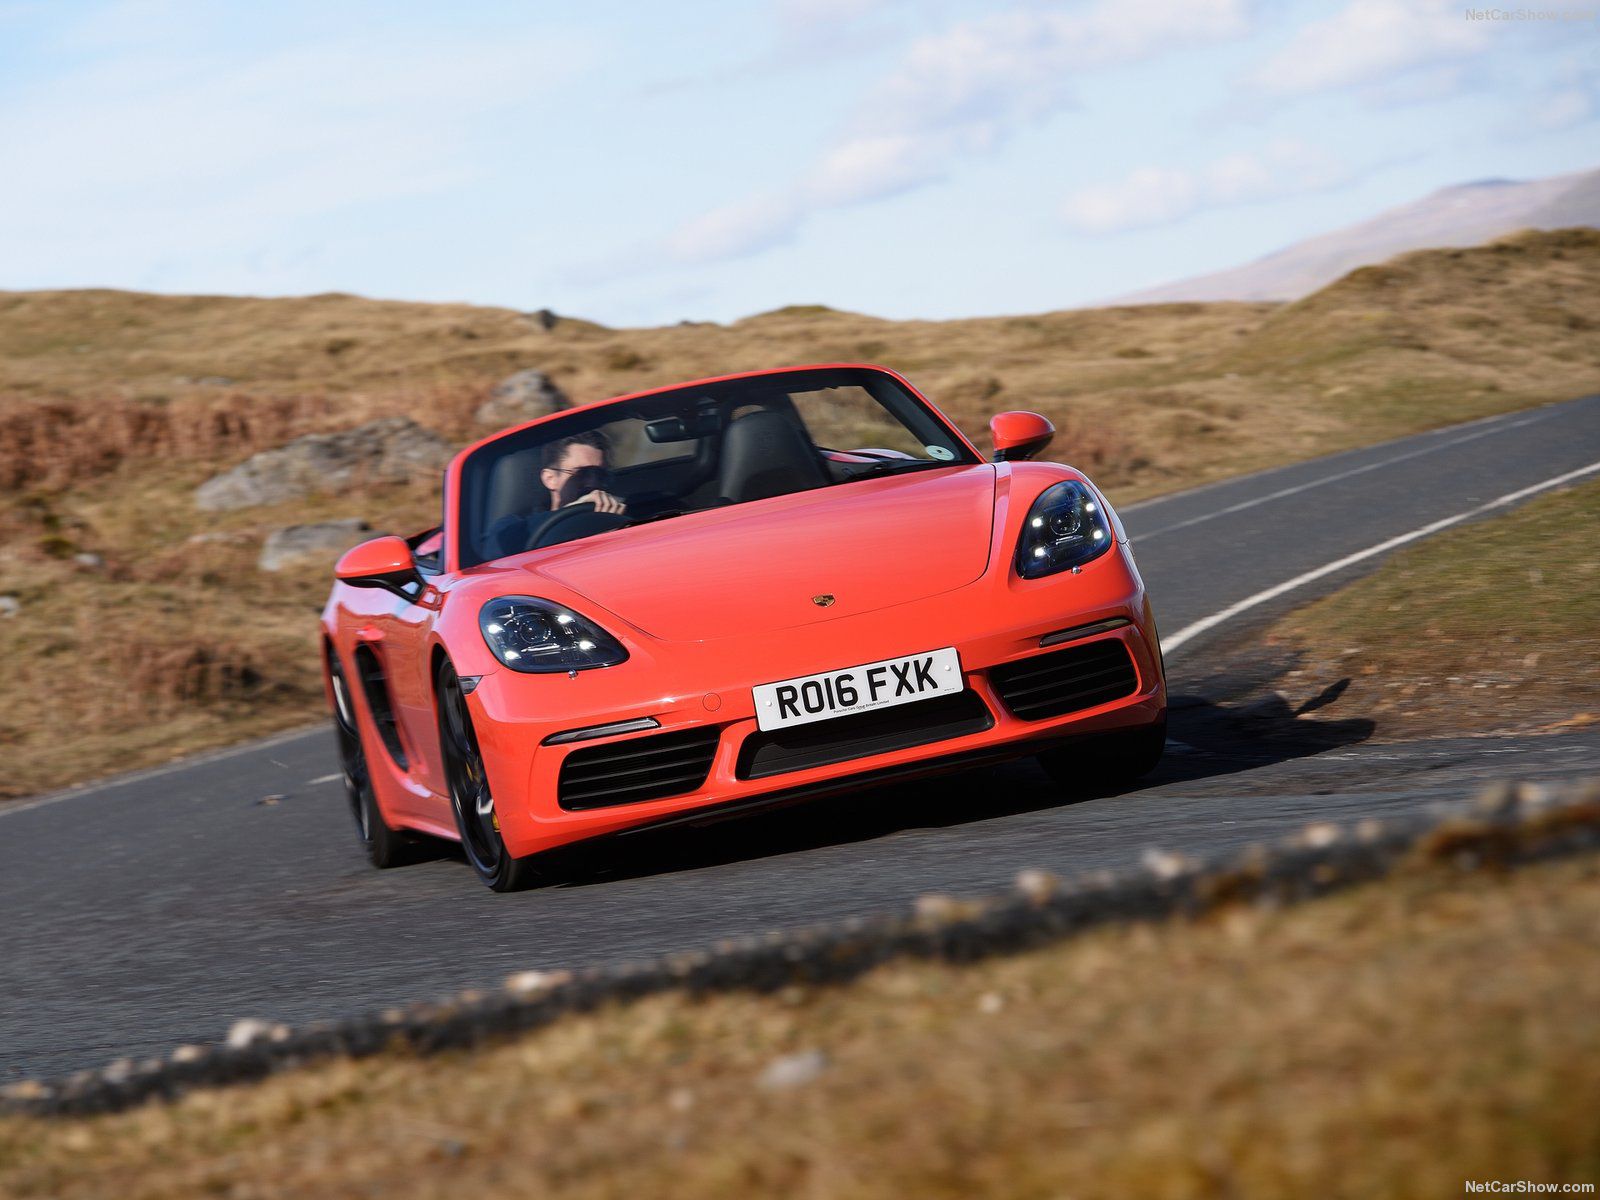
Monaco Auto sales in the 2018, after the previous year’s positive result, dropped down 5.5% recording 3.159 sales. Mercedes kept the leadership for the 5th consecutive year, even if slightly falling 1.2%. Porsche, third in the ranking, showed a fantastic performance (16.5%).
Market Trend
According with data released by the Statistic bureau of the Principality of Monaco, the 2017 had been a record year for the sales of new vehicles, with a total of 3.340, up 10.6% from the previous year.
In the 2018 the market poorly performed, ending up with sales down 5.5% and 3.159 registrations.
Competitive Arena
The best selling brand in 2018 was Mercedes with 506 sales (-1,2%) ahead of Audi, poorly performing (-9.3%) with 400, Porsche with 363 – stunning performance of +16.5% – and Smart with 179 (+5.3%).
In fifth place, Land Rover with 174 (-15.1%) followed by BMW with 156 (-17%), Toyota with 145 (+4.3%), Volkswagen with 140 (-15.9%), Fiat with 126 (-27.2%) and in 10th place Mini with 114 (-27.8%).
| Rank 2018 | Rank 2017 | Sales 2018 | Sales 2017 | '+/- 2018 | Share 2018 |
|
|---|---|---|---|---|---|---|
| 1 | 1 | Mercedes | 506 | 512 | -1,2% | 16,0% |
| 2 | 2 | Audi | 363 | 400 | -9,3% | 11,5% |
| 3 | 3 | Porsche | 324 | 278 | 16,5% | 10,3% |
| 4 | 7 | Smart | 179 | 170 | 5,3% | 5,7% |
| 5 | 4 | Land Rover | 174 | 205 | -15,1% | 5,5% |
| 6 | 5 | BMW | 156 | 188 | -17,0% | 4,9% |
| 7 | 10 | Toyota | 145 | 139 | 4,3% | 4,6% |
| 8 | 8 | Volkswagen | 140 | 159 | -11,9% | 4,4% |
| 9 | 6 | Fiat | 126 | 173 | -27,2% | 4,0% |
| 10 | 9 | Mini | 114 | 158 | -27,8% | 3,6% |
| 11 | 11 | Bentley | 72 | 136 | -47,1% | 2,3% |
| 12 | 12 | Peugeot | 71 | 74 | -4,1% | 2,2% |
| 12 | 13 | Ferrari | 71 | 62 | 14,5% | 2,2% |
| 13 | 20 | Jeep | 59 | 28 | 110,7% | 1,9% |
| 14 | 14 | Ford | 55 | 60 | -8,3% | 1,7% |
| 15 | 12 | Renault | 53 | 74 | -28,4% | 1,7% |
| 15 | 17 | Jaguar | 53 | 32 | 65,6% | 1,7% |
| 16 | 16 | Lexus | 48 | 40 | 20,0% | 1,5% |
| 17 | 25 | Kia | 41 | 23 | 78,3% | 1,3% |
| 18 | 22 | Volvo | 39 | 26 | 50,0% | 1,2% |
| 19 | 17 | Citroen | 36 | 32 | 12,5% | 1,1% |
| 20 | 15 | Suzuki | 33 | 43 | -23,3% | 1,0% |
| 21 | 21 | Lamborghini | 31 | 27 | 14,8% | 1,0% |
| 22 | 24 | Hyundai | 30 | 24 | 25,0% | 0,9% |
| 23 | 29 | McLaren | 28 | 17 | 64,7% | 0,9% |
| 24 | 19 | Opel | 26 | 30 | -13,3% | 0,8% |
| 25 | 27 | Rolls-Royce | 25 | 20 | 25,0% | 0,8% |
| 26 | 20 | Alfa Romeo | 24 | 28 | -14,3% | 0,8% |
| 27 | 23 | Aston Martin | 19 | 25 | -24,0% | 0,6% |
| 28 | 28 | Dacia | 18 | 18 | 0,0% | 0,6% |
| 28 | 26 | Honda | 18 | 22 | -18,2% | 0,6% |
| 28 | 18 | Maserati | 18 | 31 | -41,9% | 0,6% |
| 29 | 24 | Nissan | 14 | 24 | -41,7% | 0,4% |
| 30 | 32 | Skoda | 10 | 5 | 100,0% | 0,3% |
| 31 | 30 | Tesla | 9 | 13 | -30,8% | 0,3% |
| 31 | 31 | Seat | 9 | 9 | 0,0% | 0,3% |
| 32 | 31 | Mazda | 7 | 9 | -22,2% | 0,2% |
| 33 | 33 | DS | 5 | 4 | 25,0% | 0,2% |
| 33 | 34 | Lotus | 5 | 3 | 66,7% | 0,2% |
| 34 | 36 | Chevrolet | 2 | 0,1% | ||
| 35 | 35 | Subaru | 1 | 1 | ||
| 35 | 35 | SsangYong | 1 | 1 | ||
| 35 | 36 | Caterham | 1 |


