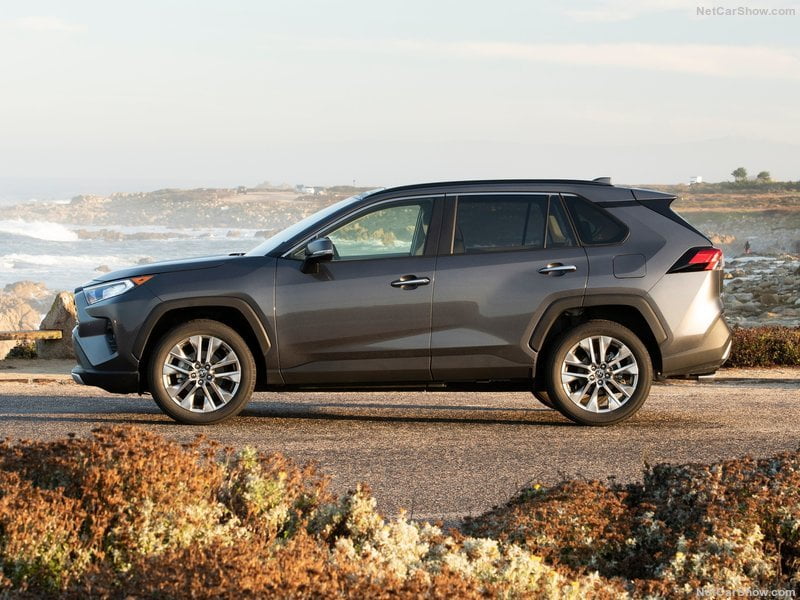
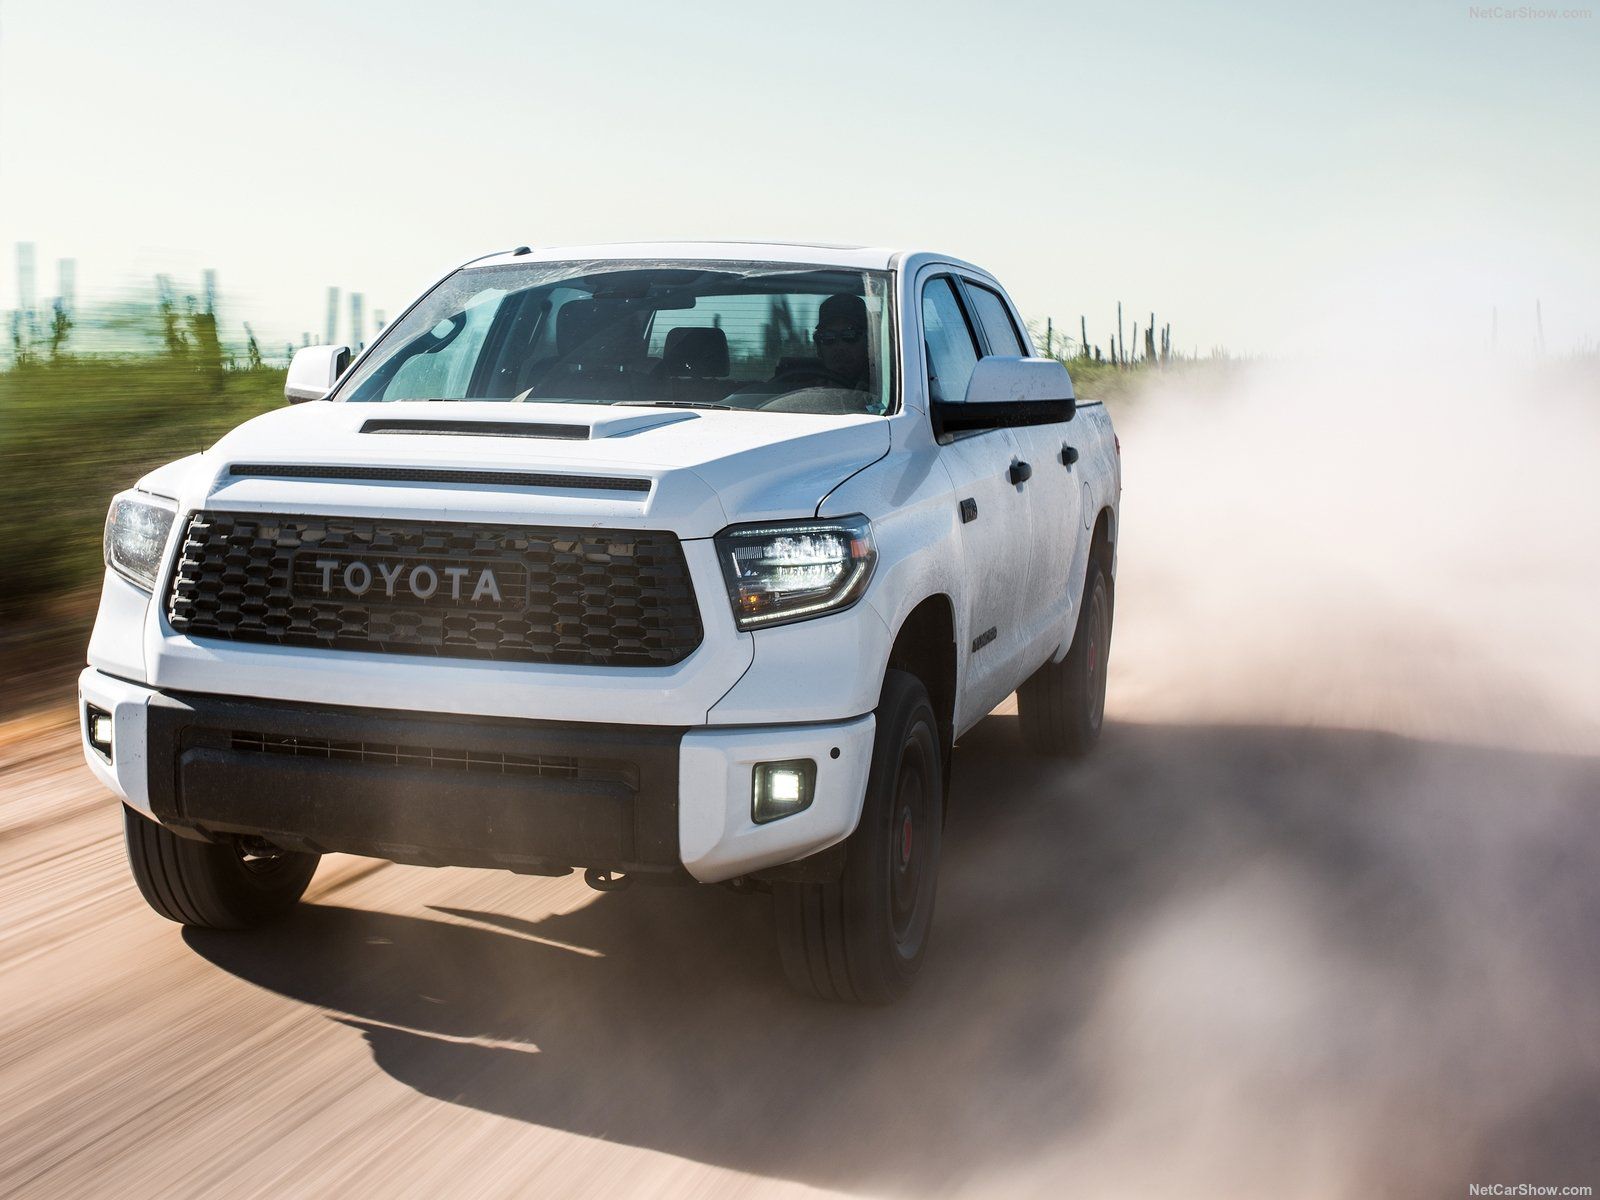
Puerto Rico Autos Market fell down 1.7% in 2019. Indeed. the Full-year registered 106.592 units, down 1.7% from the previous year. Toyota held the market throne with 27.7% of share, while Kia gained the podium outpacing Nissan.
Economic Environment
Aftershocks continue to rattle Puerto Rico after it was hit by its biggest earthquake in a century in early January, which destroyed infrastructure and temporarily left hundreds of thousands without electricity. The U.S. Geological Survey reported in late January that aftershocks are likely to persist for several years, although at a gradually slowing frequency; it also estimated that there is currently at least a 25% chance of a magnitude 6 or greater earthquake within the next 12 months.
Market Trend
Puerto Rico Vehicles Market hit the all time record in the 2013, when light vehicles exceeded the 100k for the second time in the history. Then, the market declined to 80k and the troubles generated by the devastating hurricanes affected the 2017 result.
In the 2018 the market fully recovered with a double-digit impressive score ending the year with 110.095 sales (+28.5%), the largest annual score in the decade, reaching the 100k volume for the first time since 2013.
However, in 2019, the market reported a marginally negative performance. Indeed. the Full-year registered 106.592 units, down 1.7% from the previous year.
Competitive Arena
Brand-wise, in 2019 reported the same leader, Toyota, dominating the market with 29.486 sales (+0.1%) and 27.7% of share.
In second place Hyundai with 14.7% market share, followed by Kia – with 10.1% – which gained the podium overtaking Nissan.
Service Solutions
Since 2010, focus2move.com is a specialist in the automotive industry tracking monthly sales for all brands and models in the widest in the World range of countries, actually over 150. From this huge database we can extract data sorted under your own conditions and deliver historical data in excel.
If you like to receive historical data or to subscribe at monthly update, contact us at kventura@focus2move.com and we will arrange a short video call. By showing you our database and segmentation, we can find together the best solutions for your team.
| Rank 2019 | Rank 2018 | Brand | Sales 2019 | +/- YTD | Share 2019 |
|---|---|---|---|---|---|
| 1 | 1 | Toyota | 29.486 | 0,1% | 27,66% |
| 2 | 2 | Hyundai | 15.630 | 4,0% | 14,66% |
| 3 | 4 | Kia | 10.810 | 2,6% | 10,14% |
| 4 | 3 | Nissan | 9.772 | -7,8% | 9,17% |
| 5 | 5 | Ford | 7.341 | -14,5% | 6,89% |
| 6 | 6 | Mitsubishi | 7.265 | -4,0% | 6,82% |
| 7 | 7 | Jeep | 7.173 | 9,1% | 6,73% |
| 8 | 8 | Honda | 5.855 | 0,3% | 5,49% |
| 9 | 9 | Ram | 2.257 | 6,8% | 2,12% |
| 10 | 10 | BMW | 1.603 | 6,8% | 1,50% |
| 11 | 11 | Mercedes | 1.389 | 4,1% | 1,30% |
| 12 | 13 | Lexus | 1.013 | -5,0% | 0,95% |
| 13 | 15 | Acura | 949 | 12,0% | 0,89% |
| 14 | 14 | Chevrolet | 883 | 3,5% | 0,83% |
| 15 | 12 | Mazda | 866 | -34,1% | 0,81% |
| 16 | 17 | Volkswagen | 725 | -9,5% | 0,68% |
| 17 | 18 | Infiniti | 535 | -20,4% | 0,50% |
| 18 | 16 | Dodge | 443 | -46,3% | 0,42% |
| 19 | 19 | Mini | 415 | -16,8% | 0,39% |
| 20 | 21 | Volvo | 401 | 14,9% | 0,38% |
| 21 | 20 | Audi | 307 | -18,6% | 0,29% |
| 22 | 22 | Land Rover | 299 | -5,7% | 0,28% |
| 23 | 23 | Subaru | 281 | -1,7% | 0,26% |
| 24 | 26 | Porsche | 213 | 17,7% | 0,20% |
| 25 | 24 | Fiat | 112 | -50,4% | 0,11% |
| 26 | 29 | Lincoln | 100 | 23,5% | 0,09% |
| 27 | 28 | GMC | 99 | 1,0% | 0,09% |
| 28 | 30 | Jaguar | 88 | 37,5% | 0,08% |
| 29 | 27 | Alfa Romeo | 76 | -48,6% | 0,07% |
| 30 | 25 | Chrysler | 67 | -65,8% | 0,06% |
| 31 | 32 | Cadillac | 46 | 17,9% | 0,04% |
| 32 | 31 | Maserati | 39 | -7,1% | 0,04% |
| 33 | 33 | Buick | 37 | 76,2% | 0,03% |
| 34 | 34 | Ferrari | 9 | 0,0% | 0,01% |
| 35 | 36 | Bentley | 7 | 133,3% | 0,01% |
| 36 | 35 | Smart | 1 | -75,0% | 0,00% |
| Rank 2019 | Rank 2018 | Group | Sales 2019 | +/- 2019 | Share 2019 |
|---|---|---|---|---|---|
| 1 | 1 | Toyota Group | 30.499 | -0,1% | 28,61% |
| 2 | 2 | Hyundai-Kia | 26.440 | 3,4% | 24,80% |
| 3 | 3 | Renault Nissan Alliance | 17.572 | -6,7% | 16,49% |
| 4 | 4 | F.C.A. | 10.176 | 0,4% | 9,55% |
| 5 | 5 | Ford Group | 7.441 | -14,1% | 6,98% |
| 6 | 6 | Honda Motor | 6.804 | 1,8% | 6,38% |
| 7 | 7 | BMW | 2.018 | 0,9% | 1,89% |
| 8 | 9 | Mercedes Daimler | 1.390 | 3,9% | 1,30% |
| 9 | 8 | Volkswagen Group | 1.252 | -8,1% | 1,17% |
| 10 | 11 | General Motors | 1.065 | 5,3% | 1,00% |
| Rank 2019 | Rank 2018 | Model | Sales 2019 | 2019 Var |
|---|---|---|---|---|
| 1 | 7 | Toyota RAV4 | 7400 | 110,6% |
| 2 | 1 | Toyota Yaris | 6108 | -2,1% |
| 3 | 5 | Hyundai Tucson | 4590 | 20,1% |
| 4 | 4 | Hyundai Accent | 4406 | 10,0% |
| 5 | 2 | Toyota Tacoma | 4152 | -24,6% |
| 6 | 9 | Toyota Corolla | 3856 | 13,9% |
| 7 | 8 | Kia Rio | 3502 | 1,1% |
| 8 | 10 | Mitsubishi Mirage | 3261 | -3,1% |
| 9 | 12 | Nissan Versa | 3210 | 7,0% |
| 10 | 3 | Toyota C-HR | 3062 | -37,4% |


