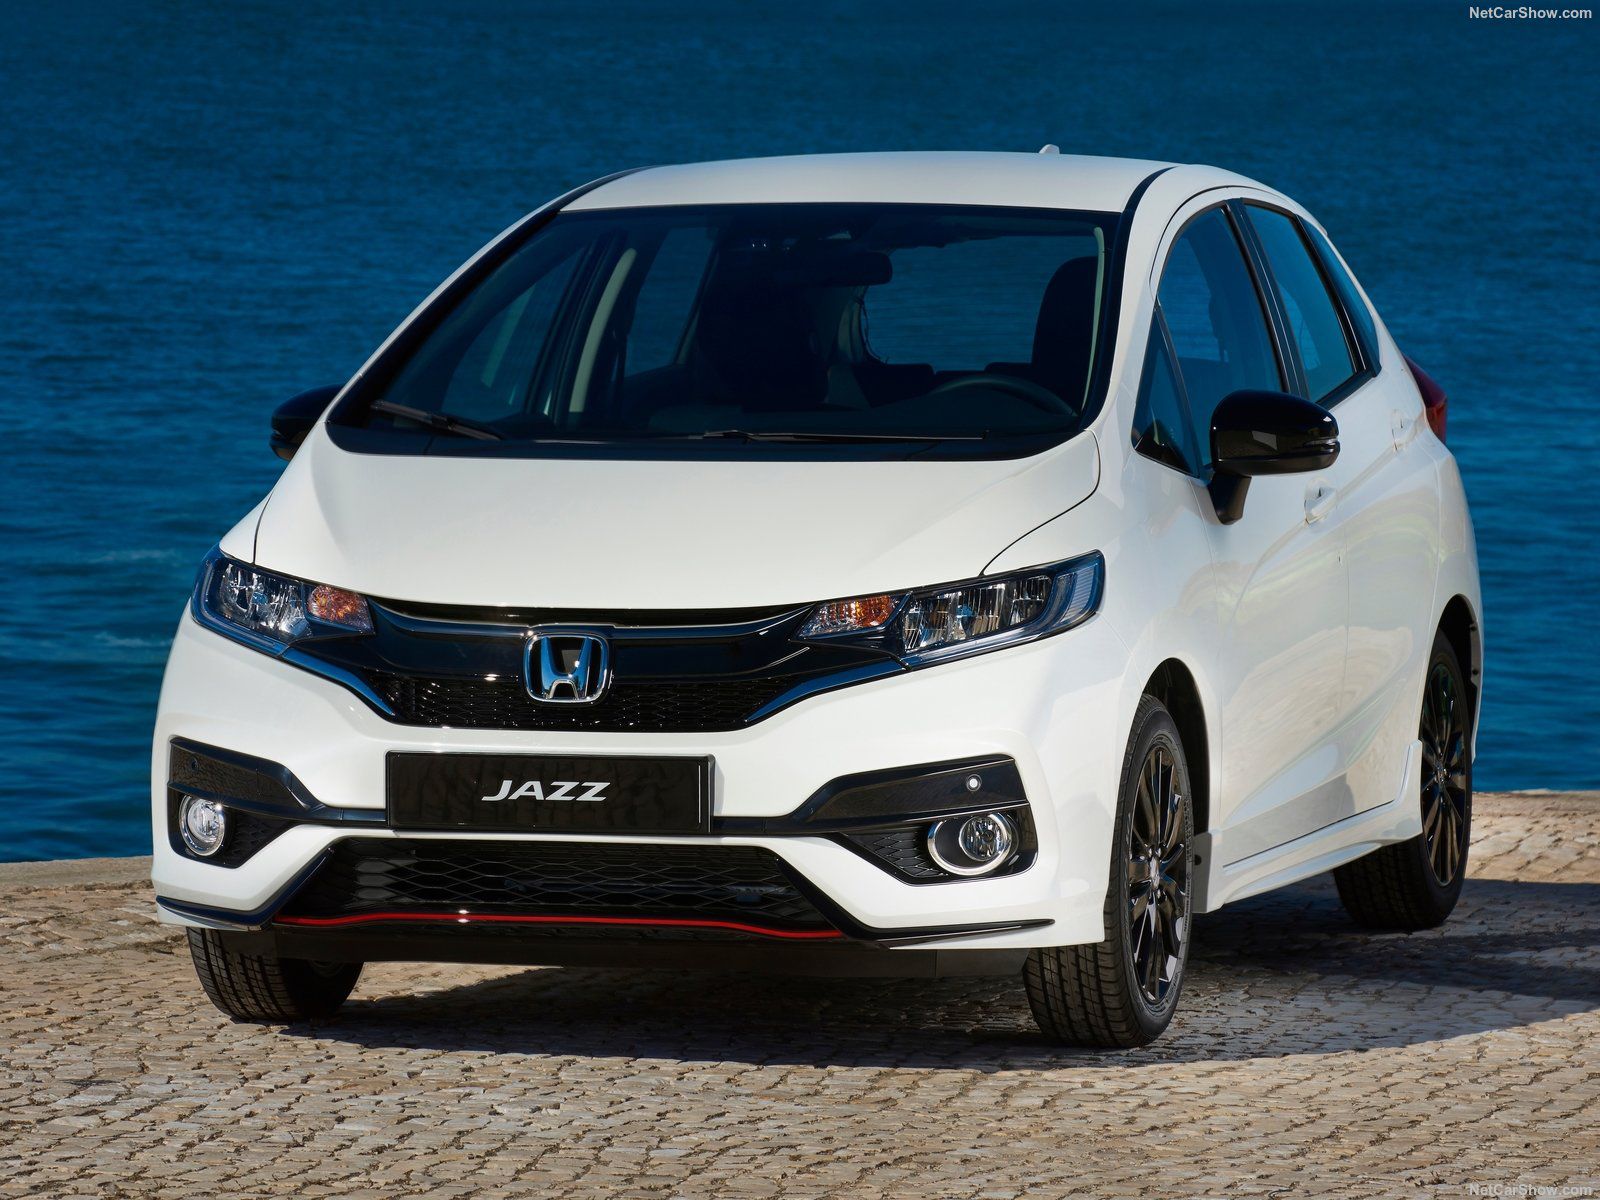
Asean best selling cars ranking in the 2017 led by the Toyota Hilux albeit losing terrain. The second, the Isuzu D-Max, reduced by half the gap and can attack the leadership in the 2018. The best car passenger was the Toyota Avanza. Top 50 models inside!
Association of Southeast Asian Nations (ASEAN) is an economical free trade are in South Asian, including the following nations: Thailand, Philippines, Vietnam, Indonesia, Malaysia, Brunei, Laos, Myanmar and Cambodia.
ASEAN Vehicles Market in recent year has lost steam and total sales declines from 3.23 million in the 2012 to 3.15 million in the 2017. Indeed while new markets are fast growing, the biggest (Indonesia, Thailand and Malaysia) have lost steam. However, in the 2017 the path was positive with an increase of 4.7% from the previous year.
Th best-selling vehicle in the region was the pick up Toyota Hilux, produced in Thailand, with 156.915 sales (-8.6%) losing terrain from the second, the Isuzu D-Max, produced in Thailand as well, with 149.300 sales (+10.6%)
Third was the model leader in Indonesia, the MPV Toyota Avanza with 136.060 sales (-3.2%) followed by the Toyota Vios with 113.074 units (+11.6%), the Toyota Fortuner with 102.202 (+4.1%) and the Honda HR-V with 90.916 (-5.2%).
In eight place the best model sold in Malaysia, the Perodua Axia with 88.417 (-0.7%) followed by the Honda City with 86.502 (+19.8%) and in 10th place the Ford Ranger with 77.532 (+26.4%).
| Rank 2017 | Rank 2016 | Sales 2017 | Sales 2016 | Variation 2017 | |
|---|---|---|---|---|---|
| 1 | 1 | Toyota Hilux | 156.915 | 171.688 | -8,6% |
| 2 | 3 | Isuzu D-Max | 149.300 | 134.941 | 10,6% |
| 3 | 2 | Toyota Avanza | 136.060 | 140.542 | -3,2% |
| 4 | 4 | Toyota Vios | 113.074 | 101.326 | 11,6% |
| 5 | 5 | Toyota Fortuner | 102.202 | 98.161 | 4,1% |
| 6 | 8 | Toyota Innova | 101.303 | 88.860 | 14,0% |
| 7 | 6 | Honda HR-V | 90.916 | 95.919 | -5,2% |
| 8 | 7 | Perodua Axia | 88.417 | 89.059 | -0,7% |
| 9 | 9 | Honda City | 86.502 | 72.228 | 19,8% |
| 10 | 10 | Ford Ranger | 77.532 | 61.353 | 26,4% |
| 11 | 14 | Toyota Calya | 73.236 | 48.287 | 51,7% |
| 12 | 15 | Perodua Alza | 50.057 | 46.002 | 8,8% |
| 13 | 13 | Honda Jazz | 47.160 | 49.259 | -4,3% |
| 14 | 31 | Daihatsu Sigra | 44.993 | 31.939 | 40,9% |
| 15 | 29 | Honda Civic | 43.758 | 34.208 | 27,9% |
| 16 | 11 | Toyota Yaris | 43.475 | 54.414 | -20,1% |
| 17 | 25 | Honda Brio Satya | 43.378 | 36.468 | 18,9% |
| 18 | 23 | Suzuki Ertiga | 43.089 | 36.768 | 17,2% |
| 19 | 27 | Proton Saga | 42.978 | 34.519 | 24,5% |
| 20 | 12 | Honda BR-V | 42.763 | 52.038 | -17,8% |
| 21 | 32 | Suzuki Carry Pick Up | 42.185 | 31.620 | 33,4% |
| 22 | 20 | Perodua Myvi | 41.720 | 41.562 | 0,4% |
| 23 | 22 | Daihatsu Gran Max PU | 39.895 | 37.996 | 5,0% |
| 24 | 34 | Mitsubishi Triton | 38.771 | 30.591 | 26,7% |
| 25 | 18 | Daihatsu Xenia | 38.651 | 44.766 | -13,7% |
| 26 | 35 | Mazda2 | 38.580 | 30.458 | 26,7% |
| 27 | 40 | Honda CR-V | 38.505 | 22.794 | 68,9% |
| 28 | 19 | Hino | 37.423 | 41.946 | -10,8% |
| 29 | 24 | Mitsubishi Pajero Sport | 37.252 | 36.560 | 1,9% |
| 30 | 30 | Nissan Navara | 36.820 | 32.101 | 14,7% |
| 31 | 28 | Nissan Almera | 36.345 | 34.296 | 6,0% |
| 32 | 26 | Toyota Corolla | 34.958 | 36.002 | -2,9% |
| 33 | 33 | Toyota Hiace | 32.399 | 31.578 | 2,6% |
| 34 | 16 | Honda Mobilio | 31.795 | 45.580 | -30,2% |
| 35 | 17 | Toyota Agya | 29.004 | 45.009 | -35,6% |
| 36 | 21 | Daihatsu Ayla | 28.184 | 39.179 | -28,1% |
| 37 | 39 | Isuzu MU-X | 26.734 | 22.947 | 16,5% |
| 38 | 48 | Mitsubishi Mirage | 24.204 | 18.987 | 27,5% |
| 39 | 44 | Ford Everest | 22.969 | 20.546 | 11,8% |
| 40 | 54 | Chevrolet Colorado | 21.413 | 15.760 | 35,9% |
| 41 | 45 | Toyota Sienta | 21.394 | 20.291 | 5,4% |
| 42 | 43 | Mazda CX-5 | 20.822 | 20.626 | 1,0% |
| 43 | 38 | Toyota Rush | 20.662 | 25.264 | -18,2% |
| 44 | 41 | Mitsubishi L300 P/U | 20.401 | 22.328 | -8,6% |
| 45 | 73 | Mitsubishi Montero Sport | 19.917 | 10.768 | 85,0% |
| 46 | 47 | Toyota Wigo | 19.664 | 18.993 | 3,5% |
| 47 | 49 | Ford Ecosport | 18.746 | 18.056 | 3,8% |
| 48 | 61 | Hyundai Accent | 17.580 | 13.387 | 31,3% |
| 49 | 67 | Mitsubishi Attrage | 16.409 | 12.270 | 33,7% |
| 50 | 46 | Mitsubishi T120-SS Pick up | 16.095 | 19.386 | -17,0% |


