Swaziland Vehicles Market is struggling hit by the fall of mineral prices, decline in the tourism and transport sectors. The new vehicles market is still really small as 95% of vehicles circulating in the country are used and imported from South Africa.
Surrounded by South Africa, except for a short border with Mozambique, Swaziland depends on South Africa for 60% of its exports and for more than 90% of its imports. Swaziland’s currency is pegged to the South African rand, effectively relinquishing Swaziland’s monetary policy to South Africa.
Mining has declined in importance in recent years. Coal, gold, diamond, and quarry stone mines are small-scale, and the only iron ore mine closed in 2014.With an estimated 40% unemployment rate, Swaziland’s need to increase the number and size of small and medium enterprises and to attract foreign direct investment is acute. Overgrazing, soil depletion, drought, and floods are persistent problems.
The IMF forecasted that Swaziland’s economy will grow at a slower pace in 2016/2017 because of a region-wide drought, which is likely to hurt Swaziland’s revenue from sugar exports and other agricultural products, and a decline in the tourism and transport sectors. Swaziland’s
revenue from SACU receipts and remittances from Swazi citizens abroad will also decline in 2016/2017, making it harder to maintain fiscal balance.
Swaziland New vehicles market never took off so far and the 95% of vehicles circulating in the roads are imported used cars, arriving from South Africa. New vehicles sales hit a record of 2812 units in the 2013 before to decline back at 2.237 in the 2016 and at 2.204 (-2.3% )in the 2017.
| Sales 2012 | Sales 2013 | Sales 2014 | Sales 2015 | Sales 2016 | Sales 2017 | Sales 2018 e | |
|---|---|---|---|---|---|---|---|
| Car+LCV | 2.641 | 2.812 | 2.831 | 2.127 | 2.257 | 2.204 | 2.359 |
| 2012 Var | 2013 Var | 2014 Var | 2015 Var | 2016 Var | 2017 Var | 2018 var e | |
|---|---|---|---|---|---|---|---|
| Car+LCV | -53,4% | 6,5% | 0,7% | -24,9% | 6,1% | -2,3% | 7,0% |
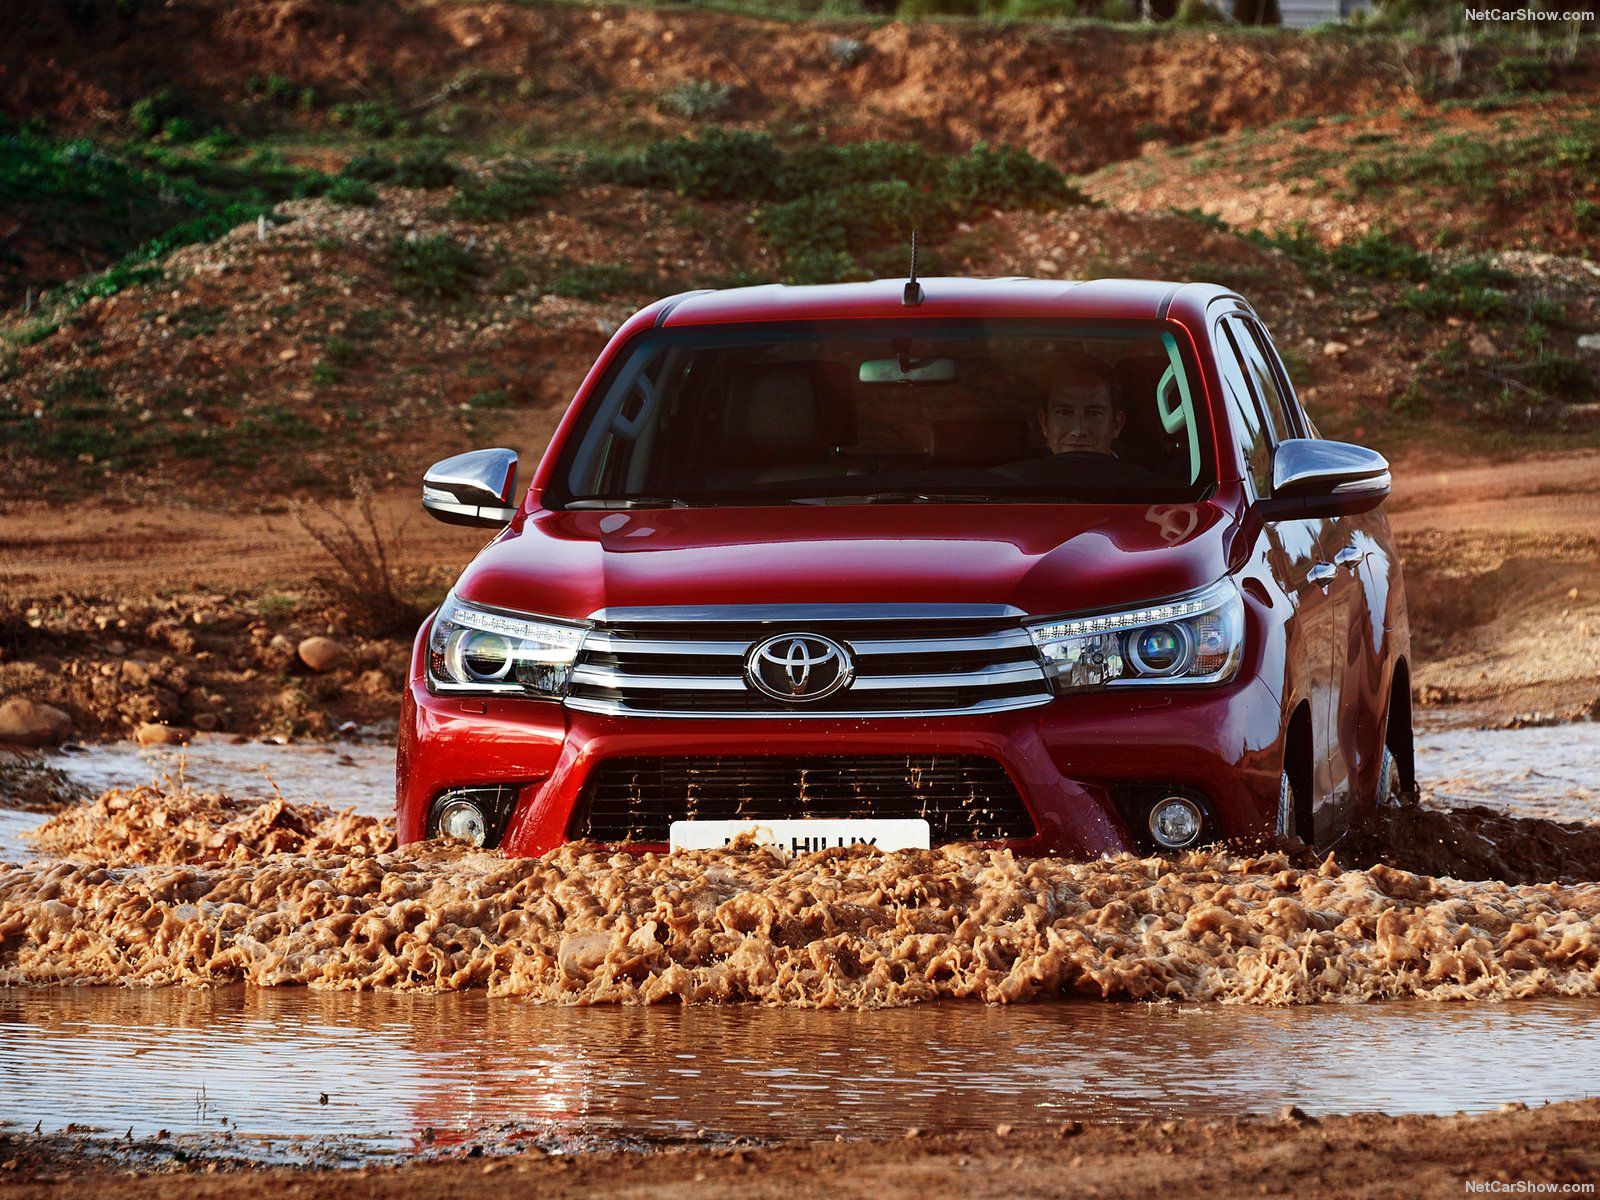
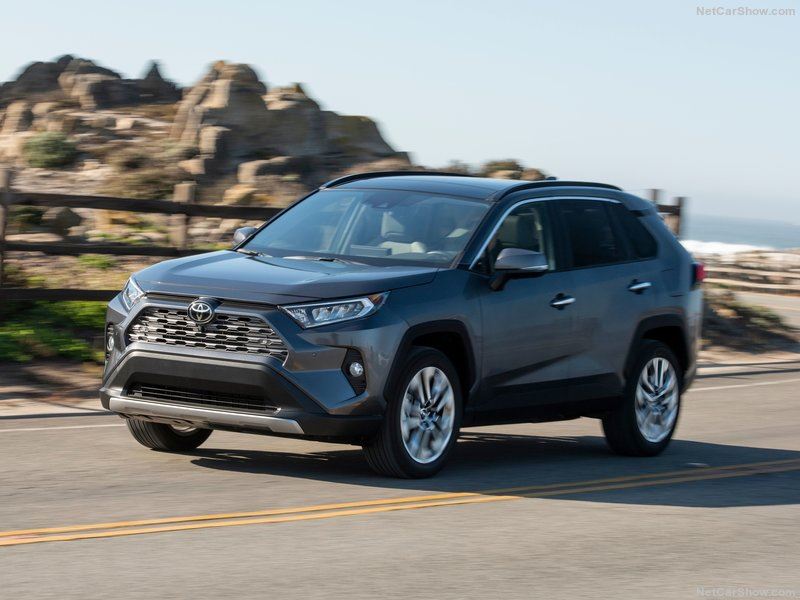
At brand wise, in the 2017 the market leader was again Toyota with 627 sales (-1.9%) with 28.4% of market share
Research, Consulting, Data & Forecast
F2M covers intensively this market with several products developed to help any investigation required. Market Researches in PDF are immediately available for download with study on the market since 2005 and with forecast up to the 2022. AutoData in EXCEL are immediately downloadable with annual sales volume, split by month, for all brands and all models distributed in the market. This year data are released year to date, but you will receive a monthly update until the year-end. See details within Swaziland Store.


