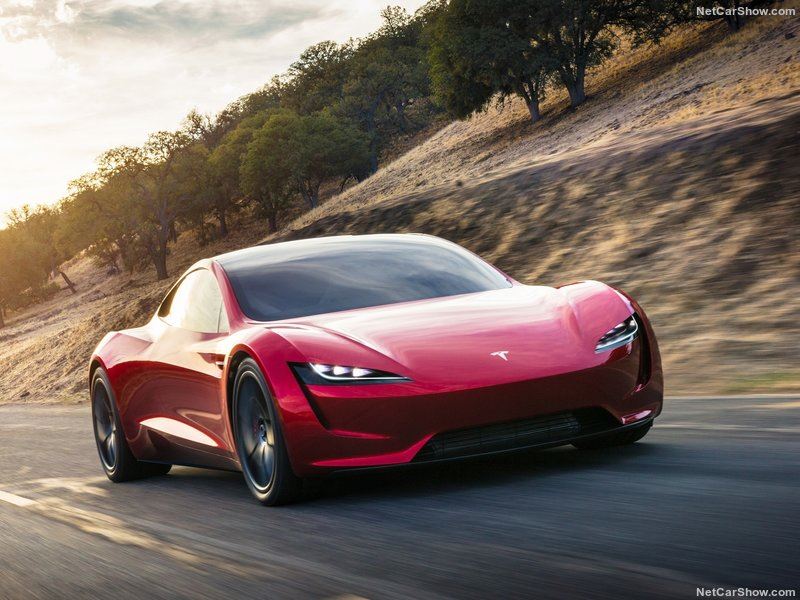
Tesla Global performance in the 2017 has been very positive with sales for the first time over the 100.000 units. Strong growth reported in Asia and in Europe, while North America was slower.
Following the rapid development reported in the period 2010-2016, during the 2017 Tesla has record over 100k global sales, first time ever, with 105.904 sales, up 47.7% from the previous year.
At regional-wise, sales are pulled up by the fastest increase reported in Asia (including China, Japan, Korea) and in the European Community. North American operations improved “only” 29.5%.
Global Automotive Database
Based on the over 750 millions vehicles sales downloaded within of GAD (Global Auto Database) collected and aggregated by hundreds selected sources covering over 140 vehicles markets worldwide, our “Brand Performance Reports” refer to registrations data.
Tesla Global Performance Report
Tesla started the sales distribution only in the 2010, selling the first 23 vehicles. Eight years after, for the first time volume exceed the 100.000 units.
At regional level, the 63% of sales are done in America while the European sales represent 24.6% and the Asian 12.4%
In our report we figure out this brand’s sales data in 67 different countries, with forecast up to the 2022.
Please click on the product figure to see the Contents details.
| Rank 2017 | Rank 2016 | Sales 2016 | Sales 2017 | Variation 2017 | Mix 2017 | Sales 2018 e | |
|---|---|---|---|---|---|---|---|
| 8 | 9 | LatAm | 1 | 3 | 200,0% | 0,0% | 3 |
| 3 | 3 | Asia | 11.191 | 21.176 | 89,2% | 20,0% | 17.162 |
| 2 | 2 | UE | 16.118 | 27.598 | 71,2% | 26,1% | 33.444 |
| 1 | 1 | America North | 41.521 | 53.790 | 29,5% | 50,8% | 83.659 |
| 4 | 4 | Pacific | 2.814 | 3.171 | 12,7% | 3,0% | 4.063 |
| 6 | 5 | CIS | 47 | 50 | 6,4% | 0,0% | 46 |
| 9 | 8 | Africa | 2 | 2 | 0,0% | 0,0% | 3 |
| 7 | 6 | Europe East | 23 | 17 | -26,1% | 0,0% | 18 |
| 10 | 7 | Asean | 3 | - | -100,0% | 0,0% | - |
| 5 | 10 | GCC | - | 98 | #DIV/0! | 0,1% | 170 |
| Total | 71.720 | 105.904 | 47,7% | 100,0% | 138.569 |


