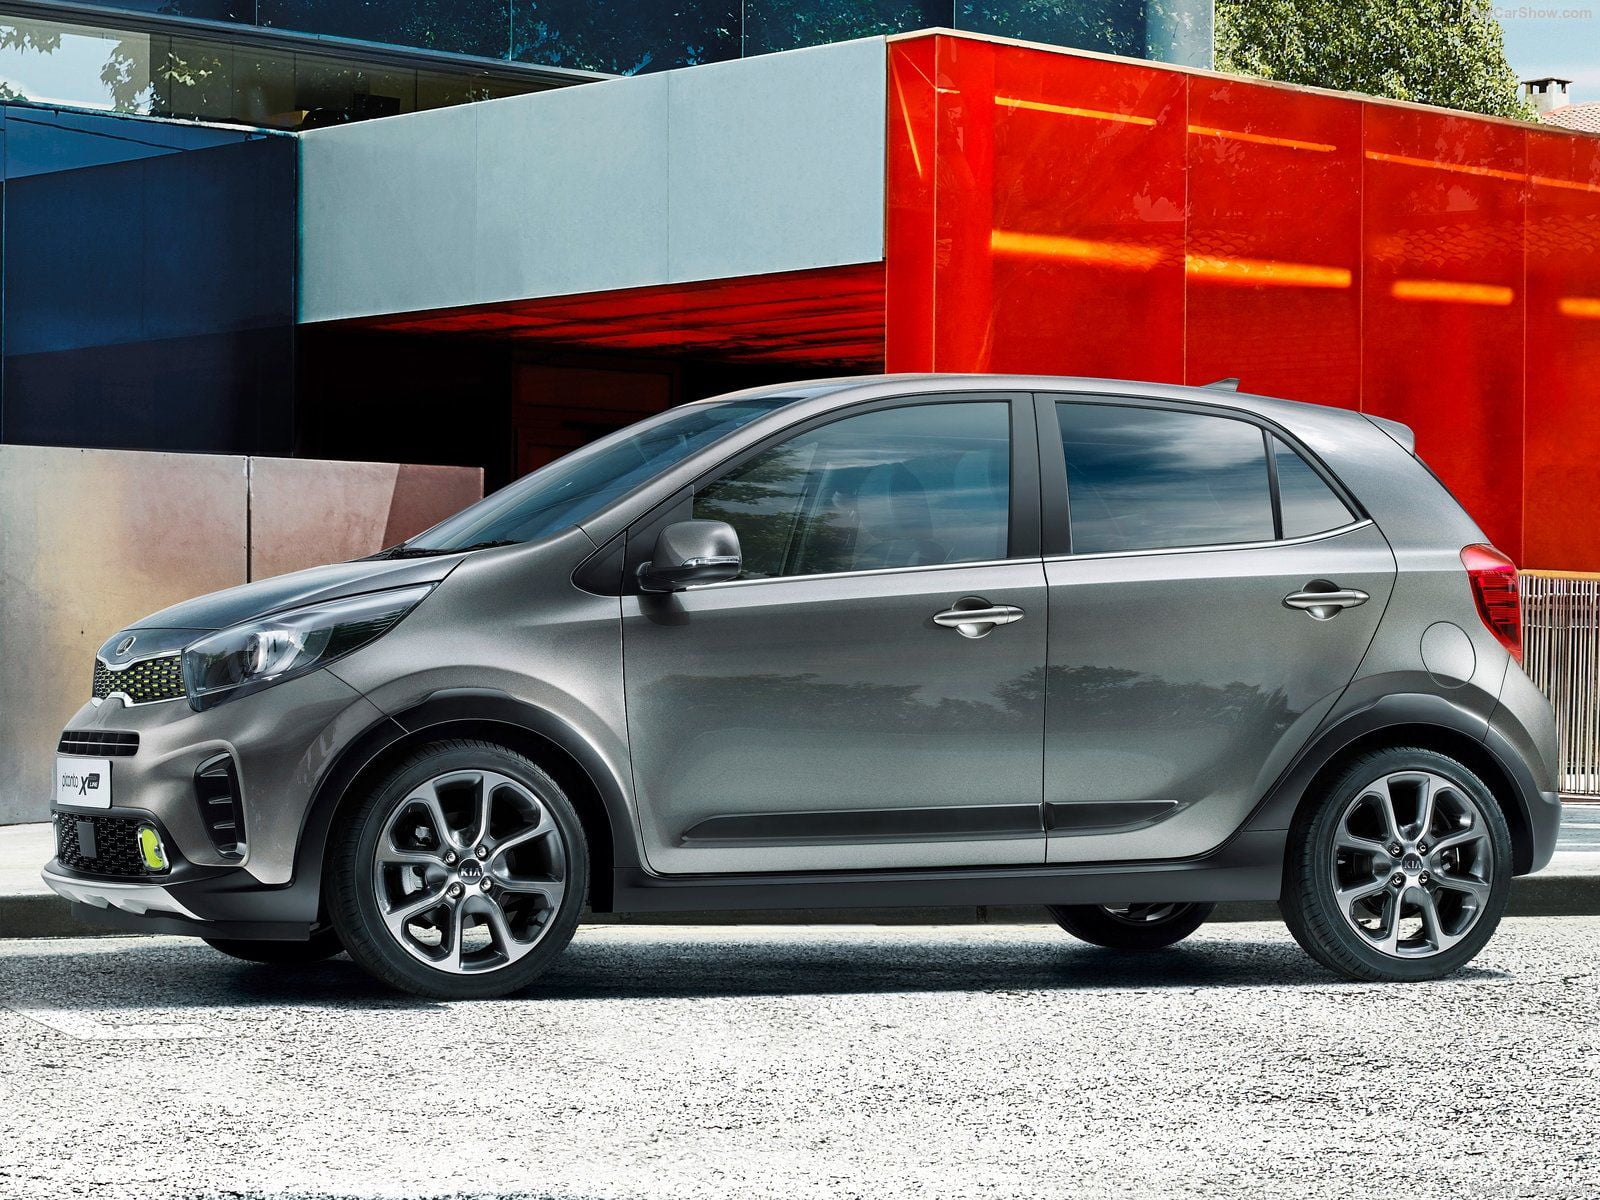
Cyprus Auto Market in 2018 grew 15.1% from last year, ending with registrations at 14.731. Toyota is the market leader – with 12.5% of market share – ahead of Ford (+21%) and Kia (+32.9%).
Economic Environment
Available fourth-quarter data has been downbeat; an uptick in joblessness and deteriorating economic sentiment are likely to drag on year-end gains. The recovery is set to continue next year, although economic growth is expected to moderate as inflation eats into consumer-spending gains—offsetting improved lending metrics and rising employment. Downside risks include high levels of public- and private-sector debt and a large, albeit gradually declining, stock of non-performing loans.
Market Trend
The automotive industry, one of the smaller within the EU, was severely hit by the financial crisis falling down during the period 2010-2013 before recovering and anticipating the economic growth. In the last three years the domestic car market grew fast with both 2015 and 2016 up 25%. In the 2017 sales improved a little with volume at 14.822 (+0.4%).
| Market | Sales 2014 | Sales 2015 | Sales 2016 | Sales 2017 | Sales 2018 | '+/- 2018 |
|---|---|---|---|---|---|---|
| Car | 8.276 | 10.344 | 12.839 | 12.794 | 14.731 | 15,1% |
In the 2018 the market improved from last year. Indeed, after a very positive start, sales grown by 15.1% from last year, closing with 14.731 units sold.
At brand-wise, market leader year to date is Toyota with 1.837 sales (+9.8%) and 12.5% of market share.
In second place Ford with 1.726 (+21%), followed by Kia with 1.648 units (+32.9%), Nissan with 1.571 (+7.9%) and Volkswagen with 989 (-2.5%).
| Rank 2018 | Rank 2017 | Sales 2018 | Sales 2017 | '+/- 2018 | Share 2018 | |
|---|---|---|---|---|---|---|
| 1 | 1 | Toyota | 1.837 | 1.672 | 9,8% | 12,5% |
| 2 | 3 | Ford | 1.726 | 1.426 | 21,0% | 11,7% |
| 3 | 4 | Kia | 1.648 | 1.240 | 32,9% | 11,2% |
| 4 | 2 | Nissan | 1.571 | 1.455 | 7,9% | 10,7% |
| 5 | 5 | Volkswagen | 989 | 1.015 | -2,5% | 6,7% |
| 6 | 7 | BMW | 711 | 754 | -5,7% | 4,8% |
| 7 | 6 | Mercedes | 703 | 770 | -8,6% | 4,8% |
| 8 | 8 | Hyundai | 561 | 655 | -14,4% | 3,8% |
| 9 | 10 | Audi | 501 | 505 | -0,8% | 3,4% |
| 10 | 9 | Honda | 412 | 550 | -25,1% | 2,8% |
| Rank 2018 | Rank 2017 | Sales 2018 | Sales 2017 | '+/- 2018 | Share 2018 | |
|---|---|---|---|---|---|---|
| 1 | 2 | Hyundai-Kia | 2.209 | 1.895 | 16,6% | 15,0% |
| 2 | 1 | Volkswagen Group | 2.172 | 1.938 | 12,1% | 14,7% |
| 3 | 4 | Toyota Group | 1.940 | 1.755 | 10,6% | 13,2% |
| 4 | 5 | Ford Group | 1.726 | 1.426 | 21,0% | 11,7% |
| 5 | 3 | Renault Nissan Alliance | 1.686 | 1.874 | -10,0% | 11,4% |
| 6 | 6 | BMW | 1.013 | 854 | 18,6% | 6,9% |
| 7 | 8 | P.S.A. | 815 | 558 | 46,1% | 5,5% |
| 8 | 7 | Mercedes Daimler | 741 | 790 | -6,2% | 5,0% |
| 9 | 13 | F.C.A. | 676 | 221 | 205,8% | 4,6% |
| 10 | 10 | Tata | 522 | 420 | 24,3% | 3,5% |
| Rank 2018 | Rank 2017 | Model | Sales 2018 | Sales 2017 | '+/- 2018 |
|---|---|---|---|---|---|
| 1 | 4 | Toyota Yaris | 588 | 537 | 9,5% |
| 2 | 3 | Nissan Qashqai | 565 | 551 | 2,5% |
| 3 | 5 | Toyota C-HR | 546 | 478 | 14,2% |
| 4 | 2 | Hyundai Tucson | 416 | 595 | -30,1% |
| 5 | 7 | Kia Rio | 412 | 459 | -10,2% |
| 6 | 16 | Ford Kuga | 386 | 217 | 77,9% |
| 7 | 8 | Kia Sportage | 359 | 390 | -7,9% |
| 8 | 1 | Ford Focus | 315 | 630 | -50,0% |
| 9 | 23 | Kia Picanto | 306 | 159 | 92,5% |
| 10 | 11 | Nissan Juke | 279 | 288 | -3,1% |


