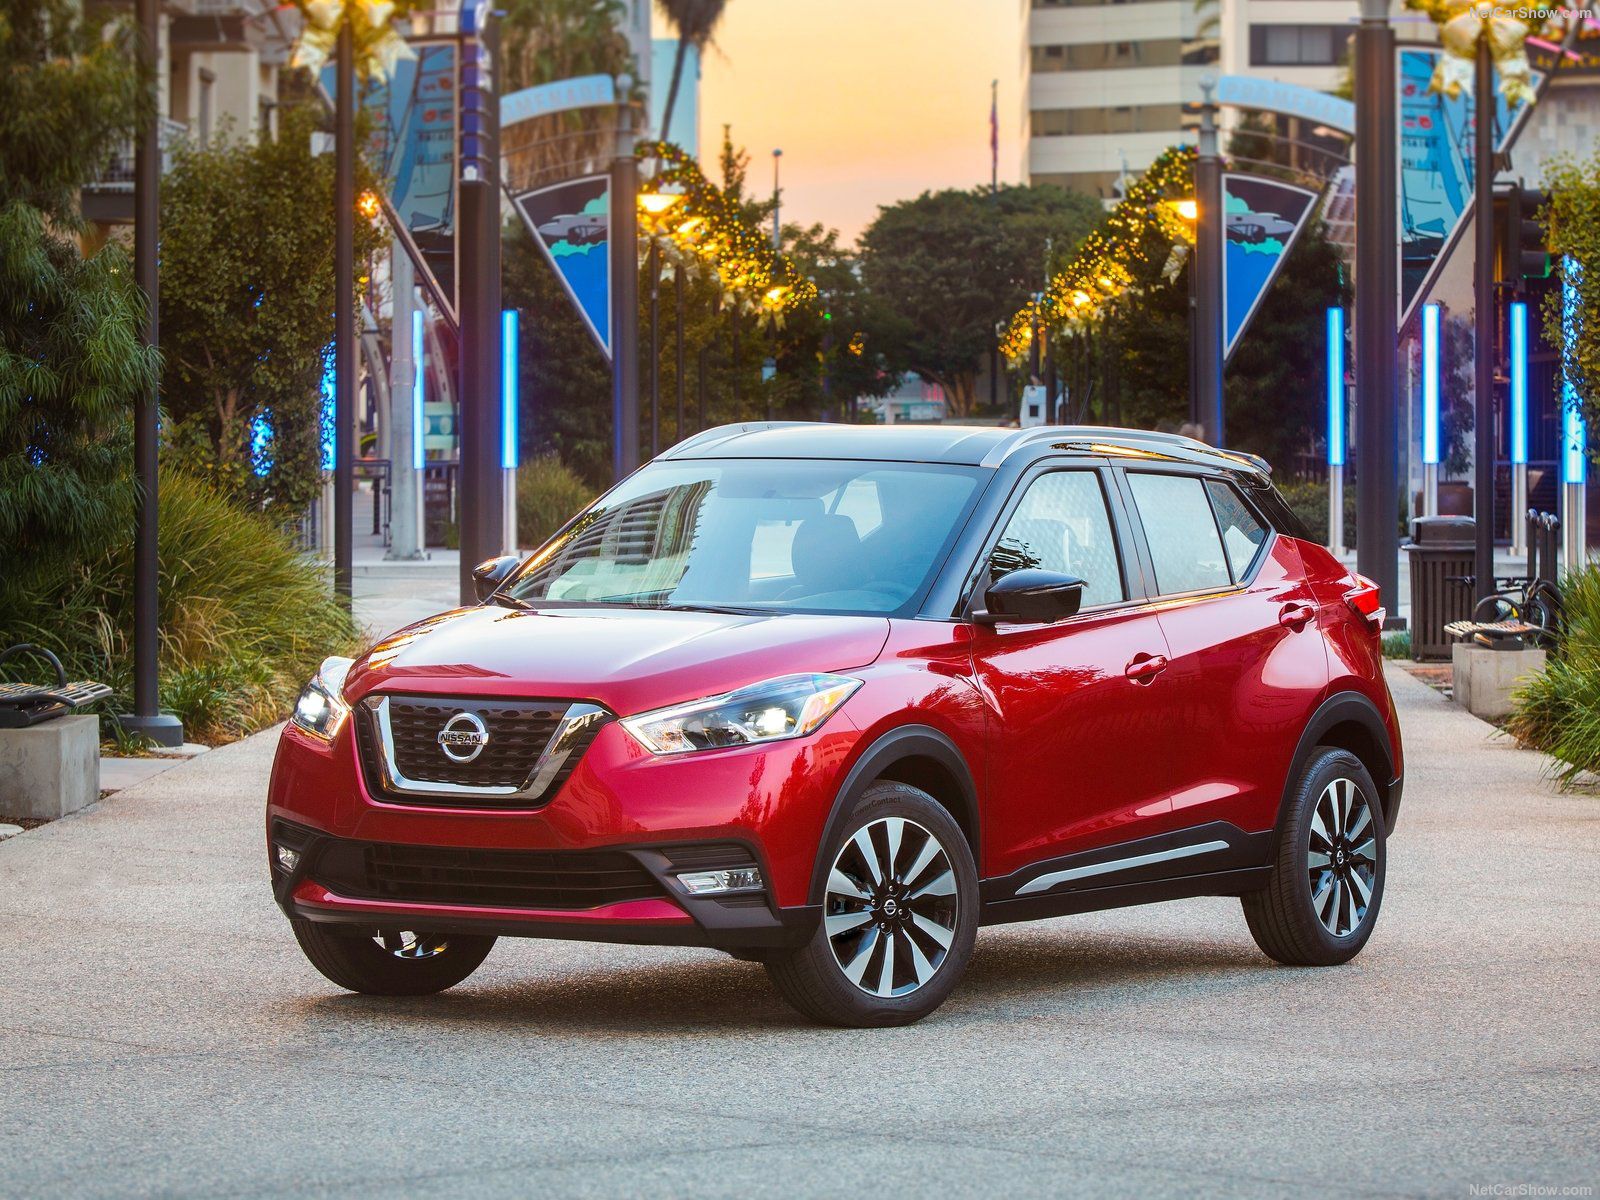
Paraguay vehicle market marked a new all-time record in 2018 booming 27.1% with 35.403 sales, thanks to strong economic growth which fueled private consumers demand. Chevrolet jumped on the throne ahead of the former leader Kia, but the winner of the year was Nissan, up 90.6%.
Economic Environment
Paraguay economy was characterized by soft dynamics that persisted in the final quarter of 2018, following weak growth in the previous quarter that was weighed on by a sharp contraction in exports. After rebounding strongly in October, economic activity lost traction in November, growing only slightly in year-on-year terms due to less activity in the agricultural and construction sectors.
Market Trend
Paraguay vehicles market in recent years suffered heavy lost in the 2016, when sales declined 15.3% from the previous year at a negative peak of 20.802. Since early 2017 the market started to recover and the total light vehicles sales have been 27.851, up 33.9%.
In 2018 the scenario further improved and the automotive industry scored a new all-time record. Indeed, as reported by the local Automotive Manufacturers Association, (CADAM), the market kept an impressive speed over the entire year, ending with 35.403 sales (+27.1%).
| Sales 2014 | Sales 2015 | Sales 2016 | Sales 2017 | Sales 2018 | '+/- 2018 |
|---|---|---|---|---|---|
| 30.691 | 24.559 | 20.802 | 27.851 | 35.403 | 27,1% |
Competitive Arena
The market leader in 2018 was Chevrolet with 5.598 sales (+43.6%) and 15.8% of market share.
In second position, the 2017 leader, Kia with 5.275 (+26.3%) followed by Toyota with 4.702 (+25.5%), Volkswagen with 3.769 (+62.4%), Hyundai with 2.907 (-1.2%) and the star of the year, Nissan with 2.261 sales, up 90.6%.
The best selling car in 2018 was the Toyota Hilux was on top with 2.480 sales (+13.4%) ahead of the Chevrolet Onix with 2.408 (+113.5%) and the Volkswagen Gol with 1.881 (+174.6%).
| Rank 2018 | Rank 2017 | Sales 2018 | Sales 2017 | '+/- 2018 | Share 2018 | |
|---|---|---|---|---|---|---|
| 1 | 2 | Chevrolet | 5.599 | 3.899 | 43,6% | 15,8% |
| 2 | 1 | Kia | 5.276 | 4.178 | 26,3% | 14,9% |
| 3 | 3 | Toyota | 4.702 | 3.746 | 25,5% | 13,3% |
| 4 | 5 | Volkswagen | 3.768 | 2.320 | 62,4% | 10,6% |
| 5 | 4 | Hyundai | 2.907 | 2.941 | -1,2% | 8,2% |
| 6 | 7 | Nissan | 2.261 | 1.186 | 90,6% | 6,4% |
| 7 | 6 | Fiat | 1.615 | 1.278 | 26,4% | 4,6% |
| 8 | 9 | Suzuki | 1.220 | 933 | 30,8% | 3,4% |
| 9 | 10 | Ford | 861 | 719 | 19,8% | 2,4% |
| 10 | 8 | Jeep | 825 | 950 | -13,1% | 2,3% |
| 11 | 12 | Isuzu | 790 | 512 | 54,2% | 2,2% |
| 12 | 14 | Mazda | 682 | 373 | 82,8% | 1,9% |
| 13 | 19 | Peugeot | 574 | 301 | 90,8% | 1,6% |
| 14 | 11 | Mercedes | 538 | 571 | -5,7% | 1,5% |
| 15 | 15 | SsangYong | 467 | 345 | 35,2% | 1,3% |
| Rank 2018 | Rank 2017 | Model | Sales 2018 | Sales 2017 | '+/- 2018 |
|---|---|---|---|---|---|
| 1 | 1 | Toyota Hilux | 2.480 | 2.186 | 13,4% |
| 2 | 4 | Chevrolet Onix | 2.408 | 1.128 | 113,5% |
| 3 | 7 | Volkswagen Gol | 1.881 | 685 | 174,6% |
| 4 | 2 | Chevrolet S10 | 1.859 | 1.643 | 13,2% |
| 5 | 5 | Kia Picanto | 1.737 | 1.100 | 57,9% |
| 6 | 3 | Kia Sportage | 1.231 | 1.156 | 6,5% |
| 7 | 9 | Kia Rio | 1.127 | 635 | 77,5% |
| 8 | 11 | Nissan Frontier | 983 | 610 | 61,2% |
| 9 | 14 | Toyota Fortuner | 836 | 551 | 51,8% |
| 10 | 6 | Hyundai Tucson | 783 | 708 | 10,6% |


