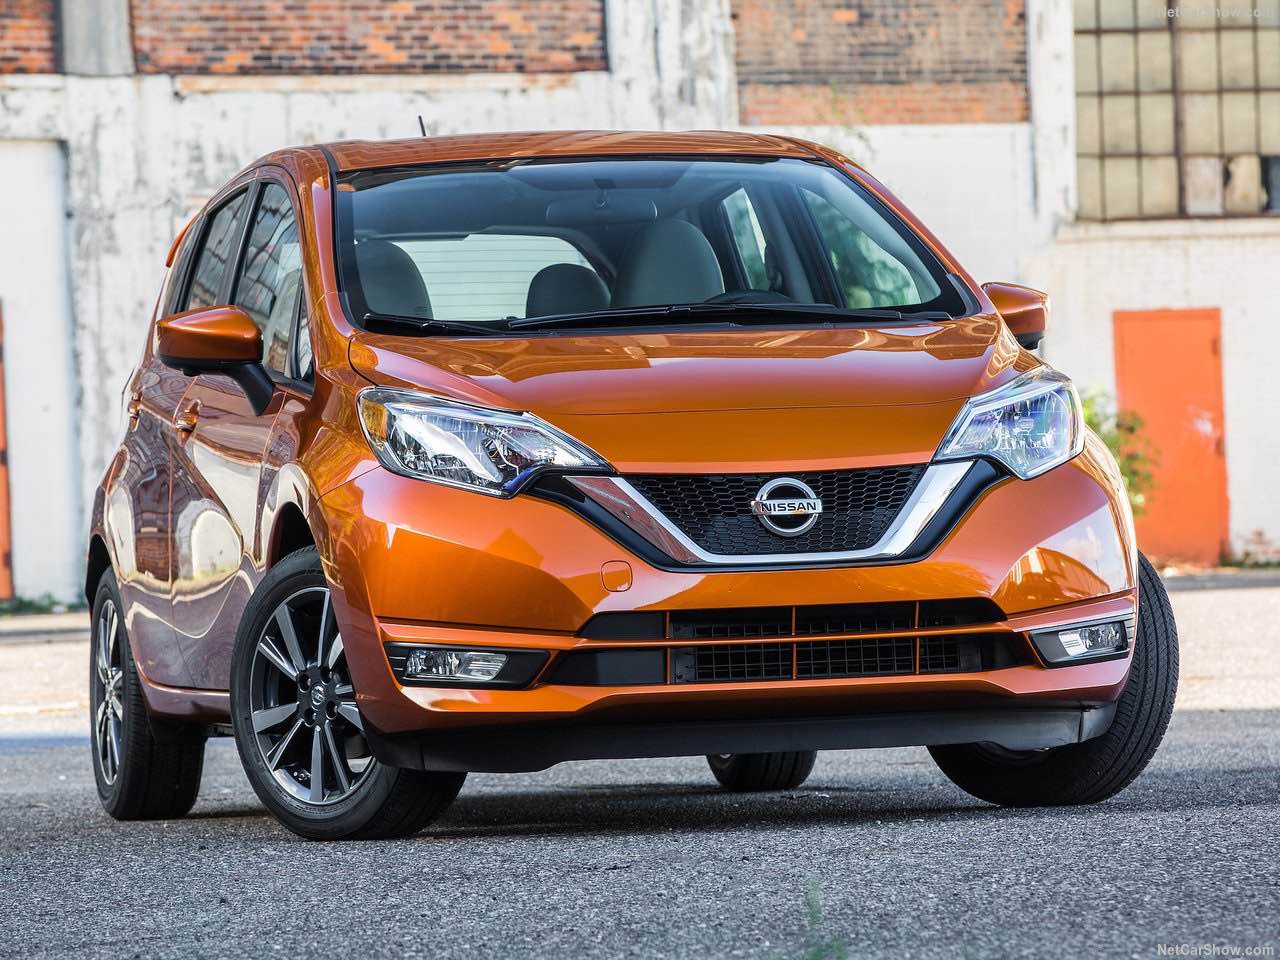
Mauritius Cars sales surged 23.1% in 2018 with 10.351 units sold. Nissan conquered the market crown with an outstanding 89.4%, followed Toyota and the previous year’s leader Kia. The worst performance was signed by Mitsubishi, dropping in 6th place.
Economic Environment
Mauritius economy benefits from political stability and sound macroeconomic management, with increased foreign direct investment (FDI) sustaining growth. Mauritius also benefits from its strategic positioning as a gateway for investments from Europe and Asia into Africa. The government’s long-term strategic vision has been set out in the country’s long-term policy document.
Market Trend
Mauritius vehicles market in recent years has been characterized by unstable sales registrations, as after the 2015’s decline, it immediately recovered in 2016 breaking the 9.000 units threshold. However, in 2017 the market fell down again 4.2%.
In the 2018, according to data released by the local Authority for Transportation, the market signed a new All-time record – soaring 23.1% – with registrations at 10.351.
In the competitive landscape, Nissan – with 15.9% of share – became the new market leader, booming 89.4% with 1.771 units sold. In second place, Toyota surging 73.5% with 1.667 sales, followed by Kia with 1.317 units (+7%) and Suzuki with 790 (+25.8%).
| Rank 2018 | Rank 2017 | Sales 2018 | Sales 2017 | '+/- 2018 | Share 2018 | |
|---|---|---|---|---|---|---|
| 1 | 4 | Nissan | 1.771 | 935 | 89,4% | 15,9% |
| 2 | 3 | Toyota | 1.667 | 961 | 73,5% | 15,0% |
| 3 | 1 | Kia | 1.317 | 1.231 | 7,0% | 11,9% |
| 4 | 6 | Suzuki | 790 | 628 | 25,8% | 7,1% |
| 5 | 5 | BMW | 667 | 655 | 1,8% | 6,0% |
| 6 | 2 | Hyundai | 664 | 1.043 | -36,3% | 6,0% |
| 7 | 11 | Mitsubishi | 638 | 185 | 244,9% | 5,7% |
| 8 | 7 | Renault | 499 | 533 | -6,4% | 4,5% |
| 9 | 9 | Honda | 392 | 380 | 3,2% | 3,5% |
| 10 | 13 | Mazda | 371 | 141 | 163,1% | 3,3% |
| 11 | 8 | Mercedes | 325 | 409 | -20,5% | 2,9% |
| 12 | 18 | Isuzu | 295 | 74 | 298,6% | 2,7% |
| 13 | 10 | Audi | 270 | 270 | 0,0% | 2,4% |
| 14 | 14 | Peugeot | 248 | 132 | 87,9% | 2,2% |
| 15 | 16 | Ford | 242 | 92 | 163,0% | 2,2% |
| 16 | 12 | Perodua | 180 | 166 | 8,4% | 1,6% |
| 17 | 15 | Volkswagen | 156 | 102 | 52,9% | 1,4% |
| 18 | 20 | Citroen | 88 | 51 | 72,5% | 0,8% |
| 19 | 17 | Jaguar | 77 | 77 | 0,0% | 0,7% |
| 20 | 26 | Jeep | 58 | 13 | 346,2% | 0,5% |
| 21 | 36 | Eicher | 55 | 0,5% | ||
| 22 | 21 | Porsche | 52 | 48 | 8,3% | 0,5% |
| 23 | 23 | Mini | 47 | 28 | 67,9% | 0,4% |
| 24 | 36 | Seat | 39 | 0,4% | ||
| 25 | 24 | Fiat | 37 | 21 | 76,2% | 0,3% |
| 25 | 29 | Yutong | 37 | 9 | 311,1% | 0,3% |
| 26 | 29 | UD Trucks | 35 | 9 | 288,9% | 0,3% |
| 27 | 19 | Land Rover | 22 | 70 | -68,6% | 0,2% |
| 28 | 27 | JMC | 20 | 11 | 81,8% | 0,2% |
| 29 | 30 | Iveco | 14 | 8 | 75,0% | 0,1% |
| 30 | 25 | Proton | 13 | 17 | -23,5% | 0,1% |
| 31 | 36 | Great Wall | 11 | 0,1% | ||
| 32 | 34 | Hino | 7 | 2 | 250,0% | 0,1% |
| 33 | 36 | Foton | 2 |


