Hong Kong Vehicles Market in 2015 hits the 6th all time record in a row ending with a fourth quarter up 7%. Fueled by improved pro capita income and renewal fleet program the market scored a unique in the world series.
Country Outlook
Hong Kong’s economy moderated in Q3 2015. The slowdown in China played a major role, as the small open economy is directly affected through slumping retail sales and financial market volatility. Latest economic indicators suggest that Q4 might have seen another deterioration.
Indeed, retail sales fell at the sharpest rate in 10 months in November and the PMI fell to a three-month low in December, dipping even further into negative territory as businesses are increasingly pessimistic about the future of the island’s economy. With the ongoing downturn, some analysts doubt whether the Hong Kong dollar’s peg to the U.S. dollar is sustainable, as the local currency is facing significant volatility.
However, on 18 January, the Hong Kong Monetary Authority affirmed that it had no plan to change its currency peg and that the money market had been operating smoothly.
Market Outlook
Despite the limited space of the Hong Kong’ territory, demand for vehicles renewal and growing pro capita income supported the vehicles market growth during all the last sixth years with a unique string of all time record volume year after year.
Indeed, according to data released by the Hong Kong Department of Transportations (HKDT), ending the year with a Q4 7% increase recovering after the fall reported in the Q3, the total new light passengers vehicles sold in the year had been 55.849, up 6.9% from the correspondent period last year,
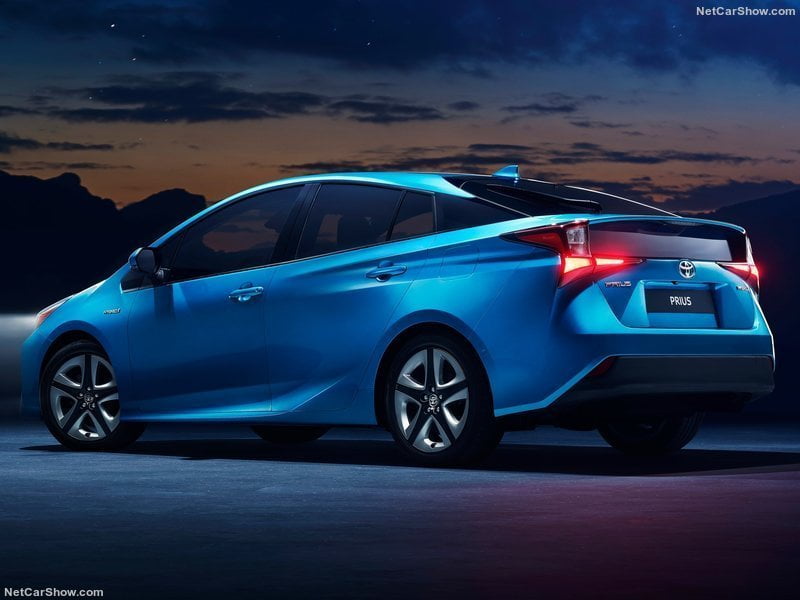
Toyota was the market leader with a record 13.466 units (+14.6%) and a market share of 24.7%.
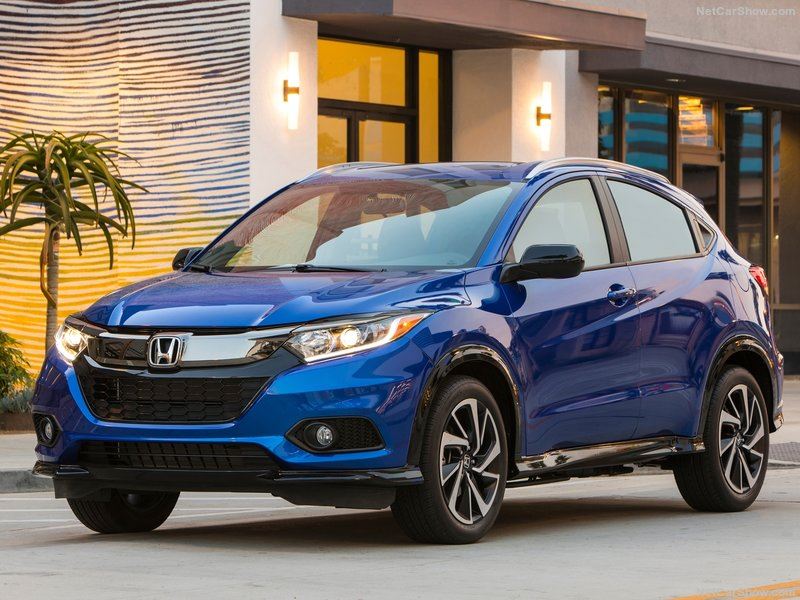
In second place Mercedes with 6.741 units (+1.4%) followed by BMW with 6.061 (+23.1%), Isuzu with 4.497 (+18.5%) and Honda with 3.337 (+14.0%).
As far as the car groups, the leader Toyota hit a market share of 30.3%, followed by Volkswagen Group with 12.6% and Mercedes-Benz with 12.5%.
As far as the best-selling models, the leader was the Toyota Hiace with 3.055 units (-18.7%) ahead of Toyota Crown Taxi derivative with 2.612 units (+56%) and the Toyota Alphand, the best car for private use, with 2.031 (+160%).
To see the statistic related to the best-selling models with the top 100 in the 2015, see here
Below, you can sort our interactive tables to see data regarding Brands, Groups and Models. Please bear in mind that sales data are subject to adjustments as sources will update their information. This report is updated at the publishing date and will not be modified while the next on this subject will always have the year to date data updated.
| Rank 2015 | Rank 2014 | Brand | 2015 | 2014 | 2015 Var | Share 2015 |
|---|---|---|---|---|---|---|
| 1 | 1 | Toyota | 13.466 | 11.753 | 14,6% | 24,7% |
| 2 | 2 | Mercedes | 6.741 | 6.651 | 1,4% | 12,4% |
| 3 | 3 | BMW | 6.061 | 4.922 | 23,1% | 11,1% |
| 4 | 4 | Isuzu | 4.497 | 3.794 | 18,5% | 8,3% |
| 5 | 7 | Honda | 3.337 | 2.926 | 14,0% | 6,1% |
| 6 | 5 | Volkswagen | 2.802 | 3.455 | -18,9% | 5,1% |
| 7 | 6 | Audi | 2.564 | 3.017 | -15,0% | 4,7% |
| 8 | 8 | Nissan | 2.237 | 2.743 | -18,4% | 4,1% |
| 9 | 11 | Hino | 1.664 | 1.216 | 36,8% | 3,1% |
| 10 | 14 | Porsche | 1.336 | 924 | 44,6% | 2,5% |
| 11 | 10 | Lexus | 1.308 | 1.463 | -10,6% | 2,4% |
| 12 | 9 | Hyundai | 1.171 | 1.538 | -23,9% | 2,2% |
| 13 | 12 | Mazda | 1.104 | 1.002 | 10,2% | 2,0% |
| 14 | 13 | Ford | 854 | 950 | -10,1% | 1,6% |
| 15 | 15 | Kia | 840 | 746 | 12,6% | 1,5% |
| 16 | 19 | Land Rover | 701 | 494 | 41,9% | 1,3% |
| 17 | 17 | Volvo | 621 | 693 | -10,4% | 1,1% |
| 18 | 16 | Mini | 589 | 725 | -18,8% | 1,1% |
| 19 | 18 | Mitsubishi Fuso | 533 | 512 | 4,1% | 1,0% |
| 20 | 23 | Subaru | 314 | 275 | 14,2% | 0,6% |
| 21 | 21 | Maserati | 296 | 310 | -4,5% | 0,5% |
| 22 | 22 | Suzuki | 242 | 282 | -14,2% | 0,4% |
| 23 | 20 | Mitsubishi | 173 | 357 | -51,5% | 0,3% |
| 24 | 26 | Jeep | 142 | 107 | 32,7% | 0,3% |
| 25 | 24 | Infiniti | 134 | 135 | -0,7% | 0,2% |
| 26 | 28 | Dongtai | 120 | 79 | 51,9% | 0,2% |
| 27 | 31 | Fiat | 100 | 61 | 63,9% | 0,2% |
| 28 | 29 | Ferrari | 94 | 71 | 32,4% | 0,2% |
| 29 | 27 | Bentley | 89 | 97 | -8,2% | 0,2% |
| 30 | 25 | Jaguar | 75 | 121 | -38,0% | 0,1% |
| 31 | 34 | Smart | 63 | 33 | 90,9% | 0,1% |
| 32 | 35 | Alfa Romeo | 54 | 29 | 86,2% | 0,1% |
| 33 | 33 | Lamborghini | 47 | 35 | 34,3% | 0,1% |
| 34 | 32 | Rolls-Royce | 33 | 41 | -19,5% | 0,1% |
| 35 | 36 | Aston Martin | 30 | 24 | 25,0% | 0,1% |
| 36 | 37 | McLaren | 24 | 21 | 14,3% | 0,0% |
| 37 | 38 | Dongfeng | 2 | 17 | -88,2% | 0,0% |
| Rank Dec | Rank 2015 | Group | Dec | 2015 | Var | 2015 Var | Dec % | 2015 % |
|---|---|---|---|---|---|---|---|---|
| 1 | 1 | Toyota | 985 | 16.438 | -22,4% | 13,9% | 21,9% | 30,3% |
| 3 | 2 | Volkswagen | 716 | 6.838 | 3,9% | -9,2% | 15,9% | 12,6% |
| 2 | 3 | Mercedes Daimler | 745 | 6.804 | 18,3% | 1,8% | 16,6% | 12,5% |
| 4 | 4 | BMW | 681 | 6.683 | 1,5% | 17,5% | 15,1% | 12,3% |
| 5 | 5 | Isuzu Motors | 357 | 4.497 | -13,1% | 18,5% | 7,9% | 8,3% |
| 6 | 6 | Honda | 282 | 3.337 | -19,2% | 14,0% | 6,3% | 6,1% |
| 7 | 7 | Renault-Nissan | 185 | 2.371 | 8,8% | -19,5% | 4,1% | 4,4% |
| 8 | 8 | Hyundai-Kia | 108 | 2.011 | -42,9% | -12,0% | 2,4% | 3,7% |
| 9 | 9 | Mazda | 106 | 1.104 | -43,9% | 10,2% | 2,4% | 2,0% |
| 14 | 10 | Ford | 26 | 854 | -62,3% | -10,1% | 0,6% | 1,6% |
| Rank Dec | Rank 2015 | Model | Sales Dec | Sales 2015 | Dec Var | 2015 Var | Share Dec | Share 2015 |
|---|---|---|---|---|---|---|---|---|
| 2 | 1 | Toyota Hiace | 205 | 3.055 | -18,7% | -1,3% | 5,3% | 6,5% |
| 1 | 2 | Toyota Crown LPG Taxi | 529 | 2.612 | 316,5% | 56,5% | 13,7% | 5,5% |
| 65 | 3 | Toyota Alphard | - | 2.031 | -100,0% | 160,7% | 0,0% | 4,3% |
| 65 | 4 | Toyota Noah | - | 1.287 | -100,0% | -28,6% | 0,0% | 2,7% |
| 15 | 5 | Mercedes C Class | 66 | 1.229 | -47,6% | 40,8% | 1,7% | 2,6% |
| 5 | 6 | Mercedes E Class | 129 | 1.223 | -15,1% | -12,8% | 3,3% | 2,6% |
| 11 | 7 | BMW 2 Series Active Tourer | 87 | 1.101 | 190,0% | 1071,3% | 2,2% | 2,3% |
| 6 | 8 | Honda Stepwagon | 125 | 1.086 | 468,2% | 48,2% | 3,2% | 2,3% |
| 10 | 9 | Volkswagen Golf | 91 | 1.066 | 4,6% | -16,1% | 2,4% | 2,3% |
| 9 | 10 | BMW 3 Series | 92 | 1.062 | -24,6% | -10,1% | 2,4% | 2,2% |
| 23 | 11 | Hyundai H-1 | 49 | 994 | -53,8% | -28,6% | 1,3% | 2,1% |
| 19 | 12 | Toyota Coaster | 58 | 896 | -26,6% | 37,4% | 1,5% | 1,9% |
| 12 | 13 | BMW 5 Series | 78 | 834 | -14,3% | -22,1% | 2,0% | 1,8% |
| 3 | 14 | Mercedes CLA | 166 | 826 | 773,7% | -2,6% | 4,3% | 1,7% |
| 8 | 15 | Audi A3 | 93 | 805 | -3,1% | 52,5% | 2,4% | 1,7% |
| 16 | 16 | Honda Jazz | 62 | 794 | -46,1% | -6,0% | 1,6% | 1,7% |
| 14 | 17 | Nissan Serena | 68 | 736 | 11,5% | -32,5% | 1,8% | 1,6% |
| 13 | 18 | BMW 4 Series | 74 | 726 | 85,0% | 42,1% | 1,9% | 1,5% |
| 21 | 19 | Porsche Macan | 54 | 717 | 63,6% | 298,3% | 1,4% | 1,5% |
| 25 | 20 | Honda Freed | 36 | 681 | -57,6% | -9,3% | 0,9% | 1,4% |
| 34 | 21 | Mercedes GLA | 24 | 604 | -67,1% | 196,1% | 0,6% | 1,3% |
| 7 | 22 | Mercedes S Class | 109 | 600 | 105,7% | -50,9% | 2,8% | 1,3% |
| 65 | 23 | Lexus NX | - | 581 | -100,0% | 149,4% | 0,0% | 1,2% |
| 35 | 24 | Mercedes A Class | 22 | 540 | -54,2% | -14,3% | 0,6% | 1,1% |
| 38 | 25 | BMW X5 | 19 | 528 | -55,8% | -17,5% | 0,5% | 1,1% |
| 61 | 26 | Honda Odyssey | 2 | 501 | -96,7% | 98,8% | 0,1% | 1,1% |
| 4 | 27 | BMW 1 Series | 143 | 498 | 581,0% | 33,5% | 3,7% | 1,1% |
| 25 | 28 | Nissan Urvan | 36 | 469 | 28,6% | -6,6% | 0,9% | 1,0% |
| 65 | 29 | Toyota Wish | - | 423 | -100,0% | -42,2% | 0,0% | 0,9% |
| 27 | 30 | Toyota Spade | 34 | 409 | #DIV/0! | #DIV/0! | 0,9% | 0,9% |


