Monaco Cars Market in 2015 led again by Mercedes, Audi and Porsche. Sales figures improved 17% at highest in the last 15 years with all the brands ranking dominated by premium brands.
Sales of vehicles in the Principality of Monaco are always special due to the frequency of stars and high income customer’s. The mix is unique in the World with luxury vehicles always on demand. In absolute, this is one of smallest market in Europe with sales between 2 and 3 thousand.
In the 2015, according with data released by the Statistic bureau of the Principality of Monaco, the total new car passenger sold in the country had been 2.859, up a robust 17.4% from the previous year., the highest level in the last 15 years.
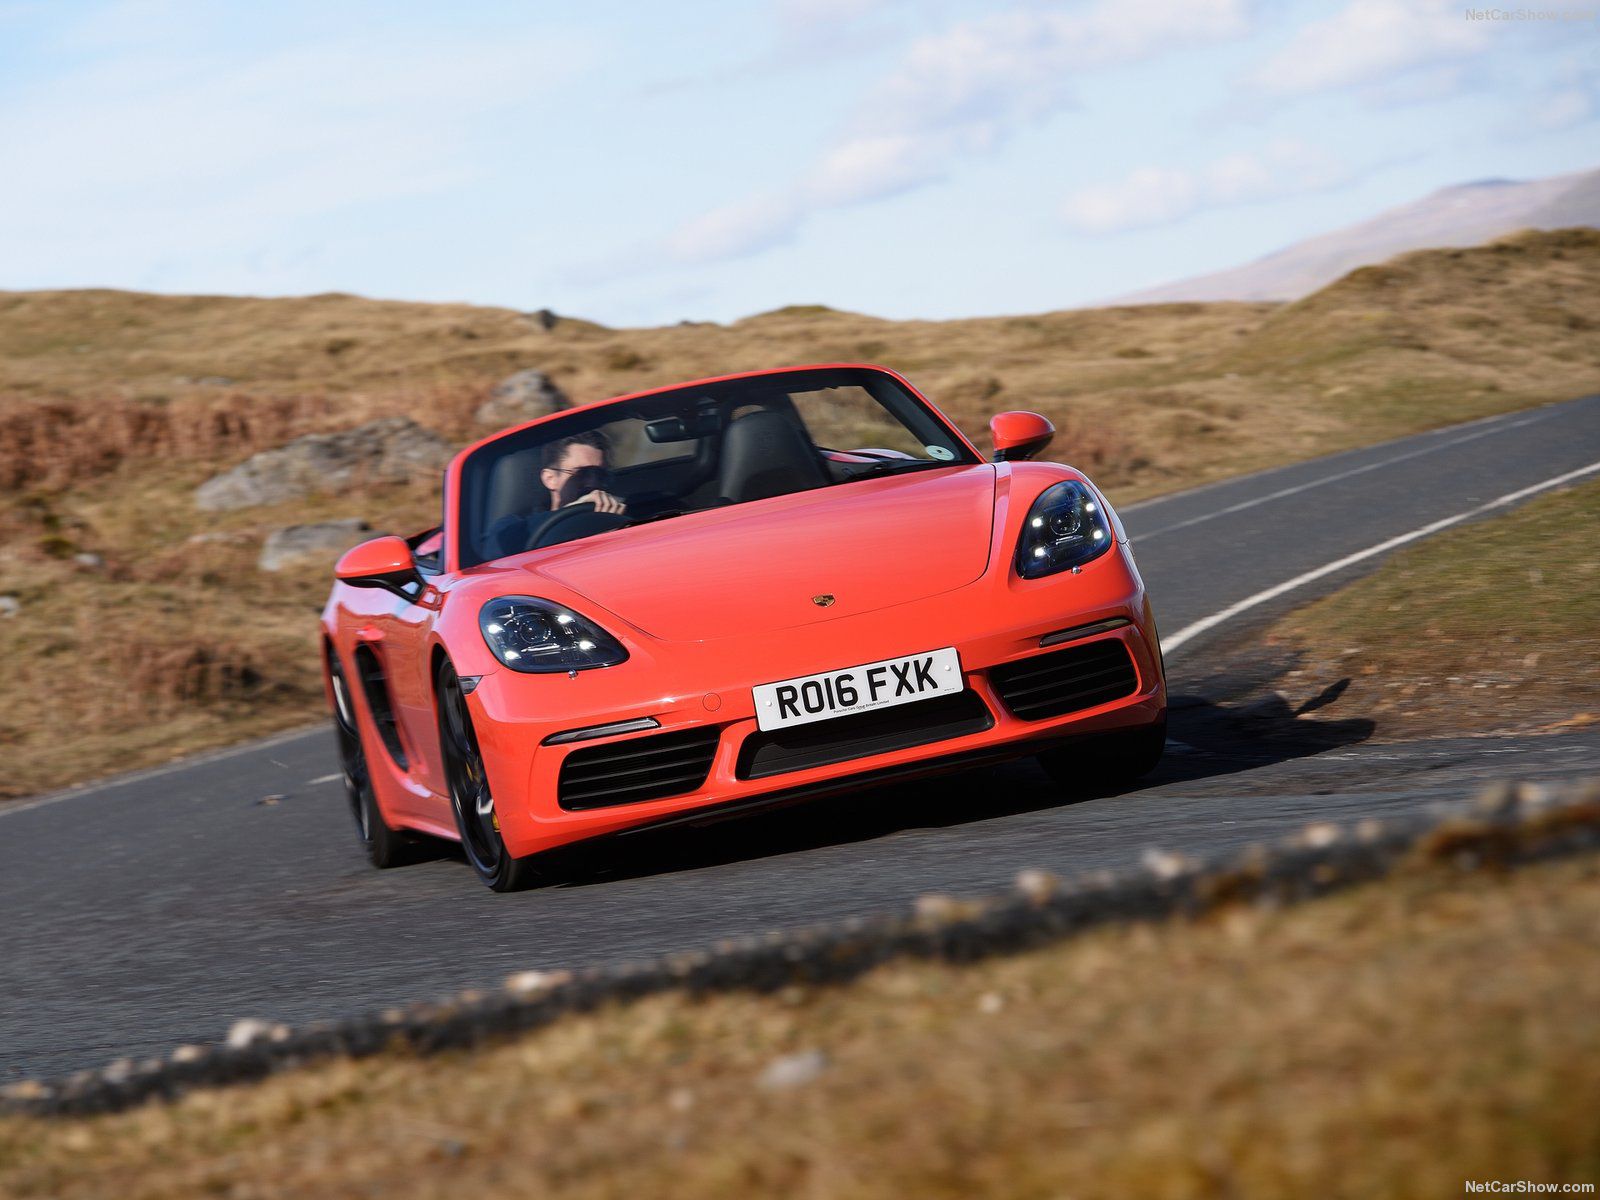
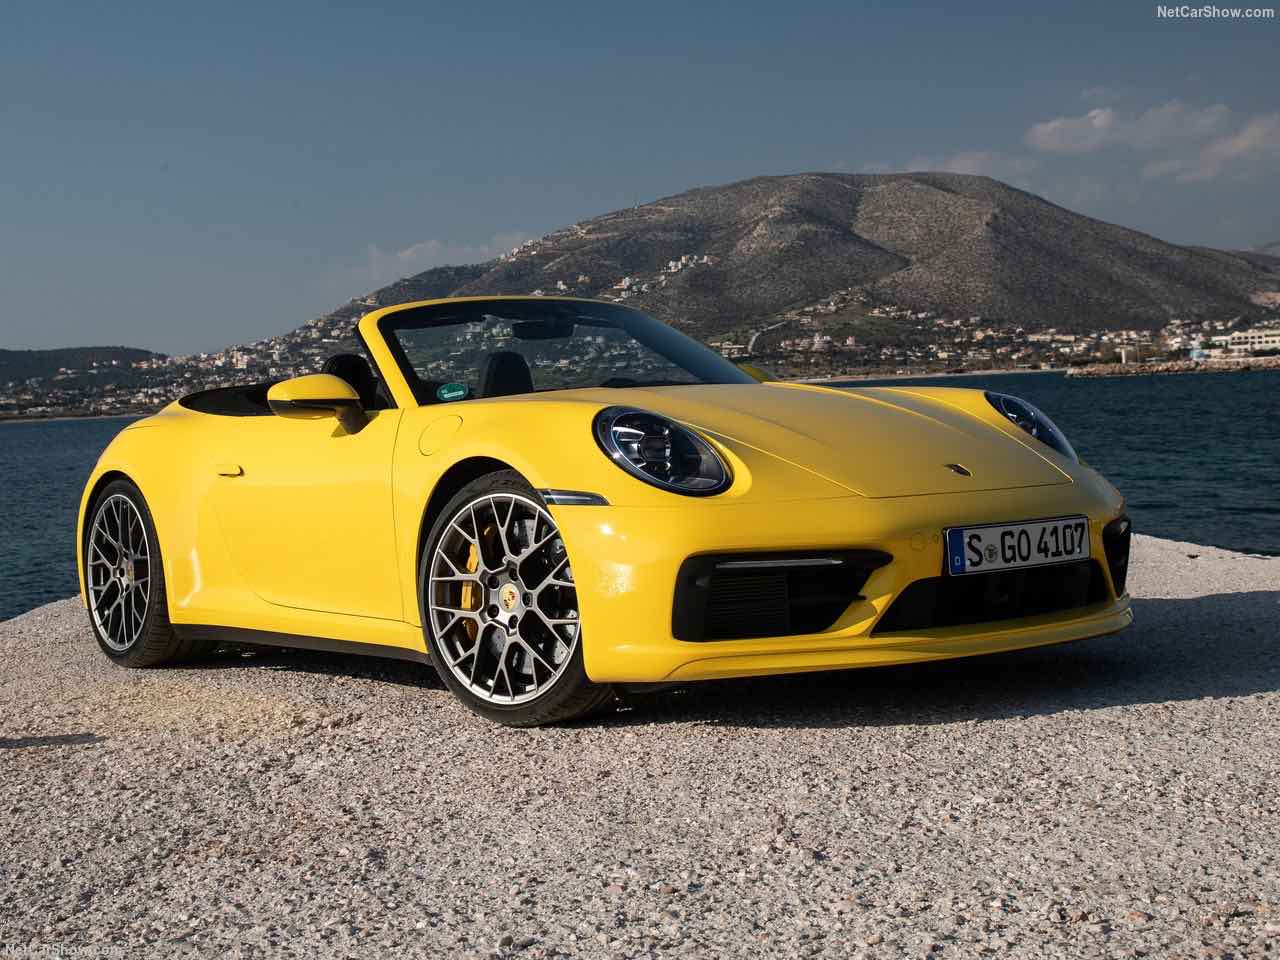
Mercedes was the Queen with 452 sales ahead of Audi with 360 sales and Porsche that confirmed the best ranking in the world with 275 sales.
Below, you can sort our interactive tables to see data regarding Brands, Groups and Models. Please bear in mind that sales data are subject to adjustments as sources will update their information. This report is updated at the publishing date and will not be modified while the next on this subject will always have the year to date data updated.
| Rank 2015 | Rank 2014 | Brand | 2015 | 2014 | 2015 Var | Share 2015 |
|---|---|---|---|---|---|---|
| 1 | 1 | Mercedes | 452 | 393 | 15,0% | 15,8% |
| 2 | 2 | Audi | 360 | 283 | 27,2% | 12,6% |
| 3 | 3 | Porsche | 275 | 216 | 27,3% | 9,6% |
| 4 | 5 | Land Rover | 195 | 151 | 29,1% | 6,8% |
| 5 | 11 | Smart | 156 | 66 | 136,4% | 5,5% |
| 6 | 6 | BMW | 149 | 142 | 4,9% | 5,2% |
| 7 | 4 | Volkswagen | 143 | 164 | -12,8% | 5,0% |
| 8 | 8 | Mini | 120 | 108 | 11,1% | 4,2% |
| 9 | 7 | Toyota | 118 | 113 | 4,4% | 4,1% |
| 10 | 9 | Fiat | 115 | 83 | 38,6% | 4,0% |
| 11 | 13 | Bentley | 67 | 53 | 26,4% | 2,3% |
| 12 | 14 | Renault | 65 | 49 | 32,7% | 2,3% |
| 12 | 10 | Peugeot | 65 | 82 | -20,7% | 2,3% |
| 13 | 12 | Ferrari | 60 | 54 | 11,1% | 2,1% |
| 14 | 15 | Opel | 51 | 46 | 10,9% | 1,8% |
| 15 | 18 | Ford | 45 | 37 | 21,6% | 1,6% |
| 16 | 16 | Lexus | 43 | 43 | 0,0% | 1,5% |
| 17 | 20 | Jeep | 37 | 29 | 27,6% | 1,3% |
| 18 | 21 | Maserati | 33 | 27 | 22,2% | 1,2% |
| 19 | 17 | Citroen | 31 | 38 | -18,4% | 1,1% |
| 20 | 26 | Suzuki | 30 | 16 | 87,5% | 1,0% |
| 20 | 22 | Rolls-Royce | 30 | 23 | 30,4% | 1,0% |
| 21 | 23 | Volvo | 26 | 22 | 18,2% | 0,9% |
| 22 | 19 | Hyundai | 23 | 36 | -36,1% | 0,8% |
| 23 | 25 | Nissan | 22 | 17 | 29,4% | 0,8% |
| 24 | 24 | Kia | 17 | 21 | -19,0% | 0,6% |
| 24 | 32 | Tesla | 17 | 5 | 240,0% | 0,6% |
| 25 | 28 | McLaren | 13 | 13 | 0,0% | 0,5% |
| 26 | 27 | Aston Martin | 12 | 14 | -14,3% | 0,4% |
| 27 | 29 | Alfa Romeo | 11 | 12 | -8,3% | 0,4% |
| 28 | 31 | Lamborghini | 10 | 6 | 66,7% | 0,3% |
| 28 | 26 | Honda | 10 | 16 | -37,5% | 0,3% |
| 28 | 31 | Skoda | 10 | 6 | 66,7% | 0,3% |
| 29 | 35 | Mazda | 8 | 2 | 300,0% | 0,3% |
| 30 | 33 | Lancia | 7 | 4 | 75,0% | 0,2% |
| 30 | 26 | Dacia | 7 | 16 | -56,3% | 0,2% |
| 31 | 34 | Seat | 5 | 3 | 66,7% | 0,2% |
| 32 | 35 | Mitsubishi | 4 | 2 | 100,0% | 0,1% |
| 32 | 36 | Infiniti | 4 | 1 | 300,0% | 0,1% |
| 33 | 36 | Morgan | 3 | 1 | 200,0% | 0,1% |
| 33 | 32 | Subaru | 3 | 5 | -40,0% | 0,1% |
| 33 | 32 | Jaguar | 3 | 5 | -40,0% | 0,1% |
| 34 | 30 | Chevrolet | 2 | 8 | -75,0% | 0,1% |
| 35 | 35 | Lotus | 1 | 2 | -50,0% | 0,0% |
| 35 | 37 | Caterham | 1 | - | #DIV/0! | 0,0% |


