Hong Kong Autos Sales in the 2016 reported a huge fall of 44% hit by new rules and by the sharp deceleration of the economy. Following years of positive growth the market reported severe lost for all top players, while the new entrance Tesla landed in 4th.
As far as the local new vehicles market, according to data released by the Hong Kong Department of Transportations (HKDT), the 2016 was really negative with annual sales fell 44.2% at 31.066 units.
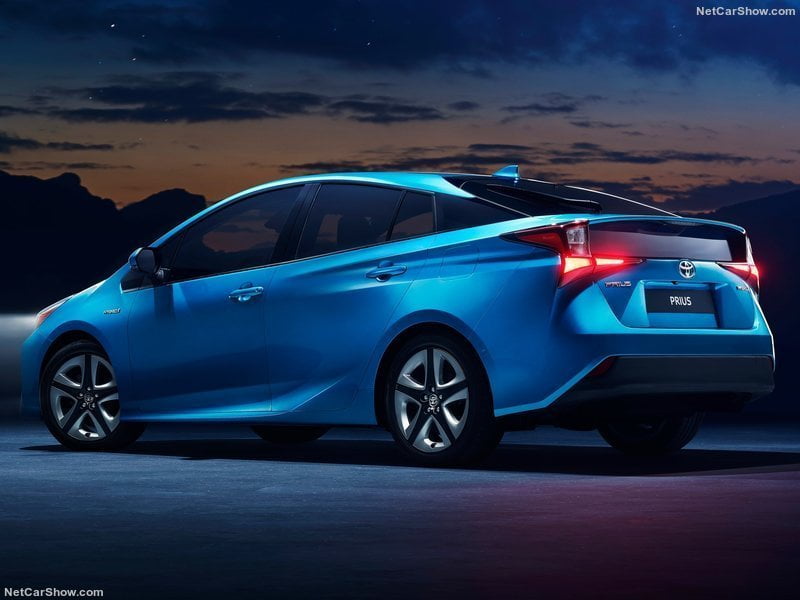
During the 2016 the market leader was Toyota with 6.542 sales (-51.4%) and 21.1% of market share.
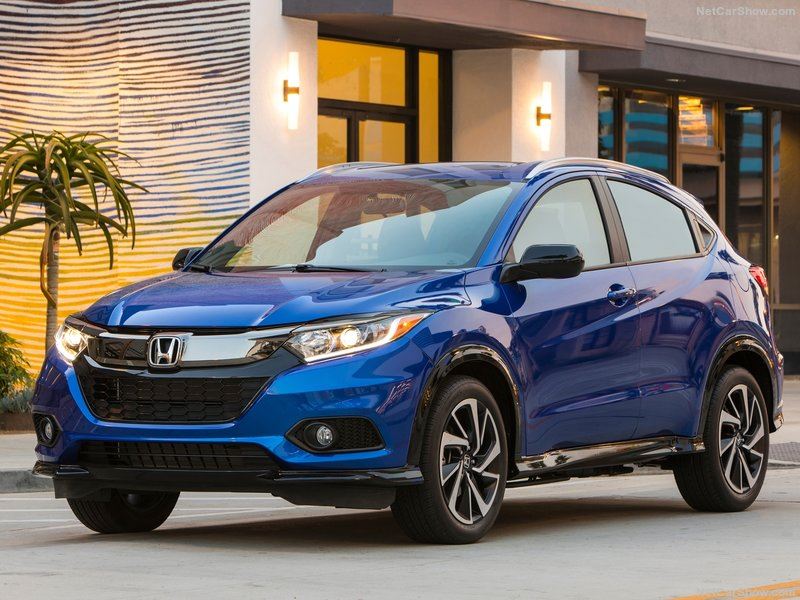
Mercedes was second with 4.938 units (-26.7%) followed by BMW with 3.003 (-50.5%), Tesla with 2.807, Honda with 1.695 (-49.2%), Audi with 1.539 (-40.0%) and Volkswagen with 1.302 (-53.5%).
To see the statistic related to the best-selling models with the top 100, see here
| Rank 2016 | Rank 2015 | Brand | Sales 2016 | Sales 2015 | Variation 2016 | Share 2016 | Share 2015 |
|---|---|---|---|---|---|---|---|
| 1 | 1 | Toyota | 6.542 | 13466 | -51,4% | 21,1% | 24,2% |
| 2 | 2 | Mercedes | 4.938 | 6741 | -26,7% | 15,9% | 12,1% |
| 3 | 3 | BMW | 3.003 | 6061 | -50,5% | 9,7% | 10,9% |
| 4 | 41 | Tesla | 2.807 | 9,0% | |||
| 5 | 5 | Honda | 1.695 | 3337 | -49,2% | 5,5% | 6,0% |
| 6 | 7 | Audi | 1.539 | 2564 | -40,0% | 5,0% | 4,6% |
| 7 | 6 | Volkswagen | 1.302 | 2802 | -53,5% | 4,2% | 5,0% |
| 8 | 10 | Porsche | 1.057 | 1336 | -20,9% | 3,4% | 2,4% |
| 9 | 9 | Hino | 986 | 1664 | -40,7% | 3,2% | 3,0% |
| 10 | 11 | Lexus | 829 | 1308 | -36,6% | 2,7% | 2,3% |
| 11 | 13 | Mazda | 612 | 1104 | -44,6% | 2,0% | 2,0% |
| 12 | 8 | Nissan | 547 | 2237 | -75,5% | 1,8% | 4,0% |
| 13 | 15 | Kia | 537 | 840 | -36,1% | 1,7% | 1,5% |
| 14 | 14 | Ford | 509 | 854 | -40,4% | 1,6% | 1,5% |
| 15 | 20 | Mitsubishi Fuso | 485 | 533 | -9,0% | 1,6% | 1,0% |
| 16 | 16 | Land Rover | 451 | 701 | -35,7% | 1,5% | 1,3% |
| 17 | 17 | Scania | 409 | 628 | -34,9% | 1,3% | 1,1% |
| 18 | 19 | Mini | 407 | 589 | -30,9% | 1,3% | 1,1% |
| 19 | 18 | Volvo | 375 | 621 | -39,6% | 1,2% | 1,1% |
| 20 | 25 | Suzuki | 341 | 242 | 40,9% | 1,1% | 0,4% |
| 21 | 12 | Hyundai | 272 | 1171 | -76,8% | 0,9% | 2,1% |
| 22 | 22 | Subaru | 251 | 314 | -20,1% | 0,8% | 0,6% |
| 23 | 33 | Jaguar | 183 | 75 | 144,0% | 0,6% | 0,1% |
| 24 | 23 | Maserati | 131 | 296 | -55,7% | 0,4% | 0,5% |
| 25 | 28 | Infiniti | 107 | 134 | -20,1% | 0,3% | 0,2% |
| 26 | 32 | Bentley | 92 | 89 | 3,4% | 0,3% | 0,2% |
| 27 | 41 | SsangYong | 85 | ||||
| 28 | 30 | Fiat | 83 | 100 | |||
| 29 | 31 | Ferrari | 81 | 94 | |||
| 30 | 26 | Mitsubishi | 56 | 173 | |||
| 31 | 41 | Renault | 53 | ||||
| 31 | 36 | Lamborghini | 53 | 47 | |||
| 32 | 34 | Smart | 39 | 63 | |||
| 32 | 35 | Alfa Romeo | 39 | 54 | |||
| 33 | 39 | McLaren | 37 | 24 | |||
| 34 | 41 | Citroen | 32 | ||||
| 35 | 37 | Rolls-Royce | 26 | 33 | |||
| 36 | 29 | Dongtai | 24 | 120 | |||
| 37 | 27 | Jeep | 21 | 142 | |||
| 38 | 38 | Aston Martin | 14 | 30 | |||
| 39 | 41 | Daewoo Bus | 7 | ||||
| 40 | 41 | Maxus | 5 | ||||
| 41 | 41 | BYD | 2 | ||||
| 41 | 41 | Daihatsu | 2 |


