Bosnia Auto Sales 2016 rebounded after having bottomed out in the second half 2015. Annual volume at the best since 210 was anyhow far from the pre-crisis level. Volkswagen was the leader.
Supported by a strong performance in the agricultural sector and electricity production, the economy of Bosnia and Herzegovina (BiH) grew at a solid pace in Q3. The positive momentum from the third quarter likely carried over into the final quarter of 2016, with growth in industrial production picking up steam in December after expanding at a solid pace in October and November.
Following three years with sales at low peak level, finally the market bottomed out and in 2016 rebounded, scoring over 9.000 annual sales, at highest since 2010. However actual level is still very far from the pre-2008 crisis level.
Indeed, according to data released by local authorities in the full year the vehicles sold have been 9.188, up 31.1%.
Volkswagen kept the leadership with 1.654 units (+51.2%) ahead of Skoda with 1.354 (+32.5%) and Opel with 897 (+44.4%). Renault and Fiat respectively in fourth and fifth place, left the top 5 unchanged from the previous year.
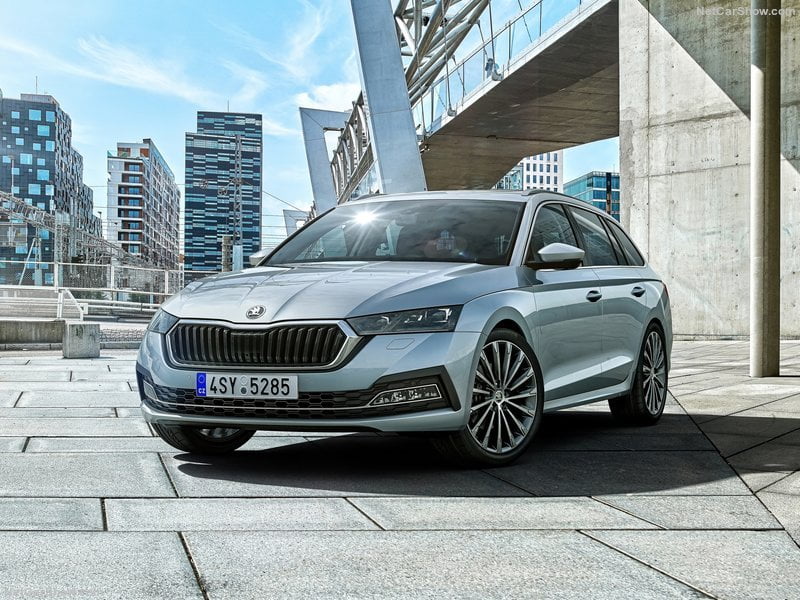
The best-selling model was again the Skoda Octavia with 604 units (+22.3%) followed by the Volkswagen Golf, up one spots from the 2015 with 535 (+74.8%), and the Renault Clio, which jumped from the fifth place with 413 sales (+44.4%).
Below, you can sort our interactive tables to see data regarding Brands, Groups and Models. Please bear in mind that sales data are subject to adjustments as sources will update their information. This report is updated at the publishing date and will not be modified while the next on this subject will always have the year to date data updated.
| Rank 2016 | Rank 2015 | BRAND | Sales 2016 | Sales 2015 | Variation 2016 | Share 2016 | Share 2015 |
|---|---|---|---|---|---|---|---|
| 1 | 1 | Volkswagen | 1.654 | 1.094 | 51,2% | 18,0% | 15,6% |
| 2 | 2 | Skoda | 1.354 | 1.022 | 32,5% | 14,7% | 14,6% |
| 3 | 3 | Opel | 897 | 621 | 44,4% | 9,8% | 8,8% |
| 4 | 4 | Renault | 727 | 444 | 63,7% | 7,9% | 6,3% |
| 5 | 5 | Fiat | 528 | 365 | 44,9% | 5,7% | 5,2% |
| 6 | 8 | Dacia | 455 | 317 | 43,4% | 5,0% | 4,5% |
| 7 | 12 | Citroen | 449 | 278 | 61,6% | 4,9% | 4,0% |
| 8 | 7 | Toyota | 430 | 332 | 29,5% | 4,7% | 4,7% |
| 9 | 11 | Peugeot | 312 | 280 | 11,5% | 3,4% | 4,0% |
| 10 | 9 | Audi | 308 | 316 | -2,7% | 3,3% | 4,5% |
| Rank 2016 | Rank 2015 | Model | Sales 2016 | Sales 2015 | 2016 Variation |
|---|---|---|---|---|---|
| 1 | 1 | Skoda Octavia | 604 | 494 | 22,3% |
| 2 | 3 | Volkswagen Golf | 535 | 306 | 74,8% |
| 3 | 5 | Renault Clio | 413 | 286 | 44,4% |
| 4 | 4 | Opel Astra | 383 | 305 | 25,6% |
| 5 | 2 | Volkswagen Passat | 333 | 308 | 8,1% |
| 6 | 7 | Skoda Rapid | 265 | 254 | 4,3% |
| 7 | 8 | Skoda Fabia | 263 | 202 | 30,2% |
| 8 | 11 | Opel Corsa | 208 | 156 | 33,3% |
| 9 | 10 | Volkswagen Polo | 201 | 162 | 24,1% |
| 10 | 6 | Dacia Duster | 190 | 263 | -27,8% |


