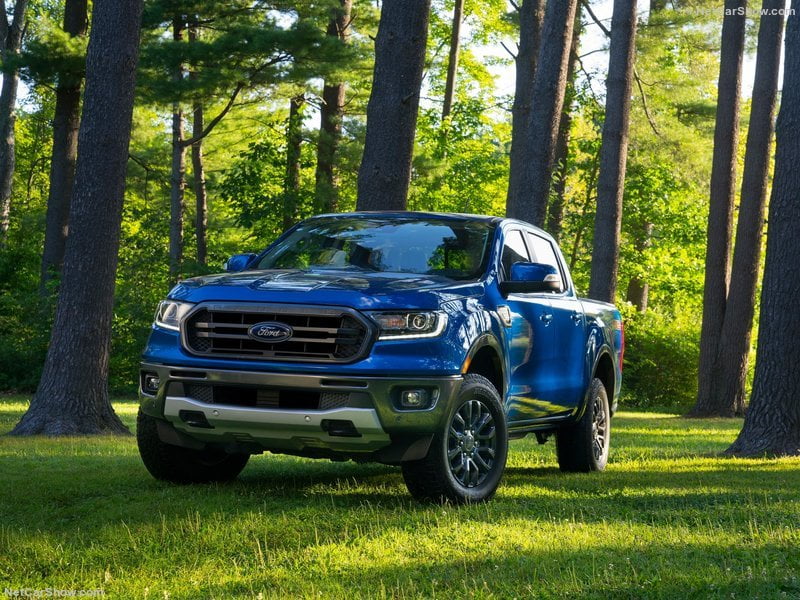
Tanzanian Auto industry in the 2019 has lost 20.2%, mainly due to a very low Q4, ending the year with only 1.900 sales, the lowest level since 2010. The top three brands, Toyota, Ford and Nissan controlled near 60% of the market. The outlook for the 2020 is moderately positive.
Economic Environment
Tanzania’s economic growth eased to 6.8% year-on-year in the third quarter of 2019, after having expanded at the fastest pace in over a year in the second quarter (Q2: +7.2% year-on-year). The third-quarter moderation was largely driven by ebbing growth in the construction sector. Meanwhile, activity in the agricultural and manufacturing sectors rose at a faster clip compared to the second quarter, buffering the slowdown somewhat.
Economic activity should remain robust next year despite moderating slightly. Buoyant private consumption; strong capital spending, particularly on large infrastructure projects; and a pick-up in government expenditure should underpin growth. However, the large current account deficit and policy uncertainty cloud outlook.
Market Trend
The new light vehicles market in Tanzania is almost stable in the range between the 2 and the 3.000 annual units, still penalized by the easy access of imported used vehicles.
In the last decade the market performed between the lower peak of 2.035 units in the 2016 and the higher of 3.314 in the 2013, with the 2018 at 2.258 units. We noted that the HCVs & Bus market is reporting a different trend with a steady growth and over 2.000 units sold in the 2018, the highest level ever.
In the 2019 the light vehicles market has lost 20.2%, mainly due to a very low Q4, ending the year with only 1.900 sales, the lowest level since 2010.
Toyota is on top of the ranking, as always, but in the last year have lost market share from a record of 52% in the 2014 to the 29% reported in 2019.
In second place Ford with 15.9% of market share and in third Nissan, with 15.9%, in recovery since the 2014, when hit the lowest peak, below 10%.
The top three brands control together over 60% of the market.
Tables with sales figures
In the tables below we report sales for top Brands


