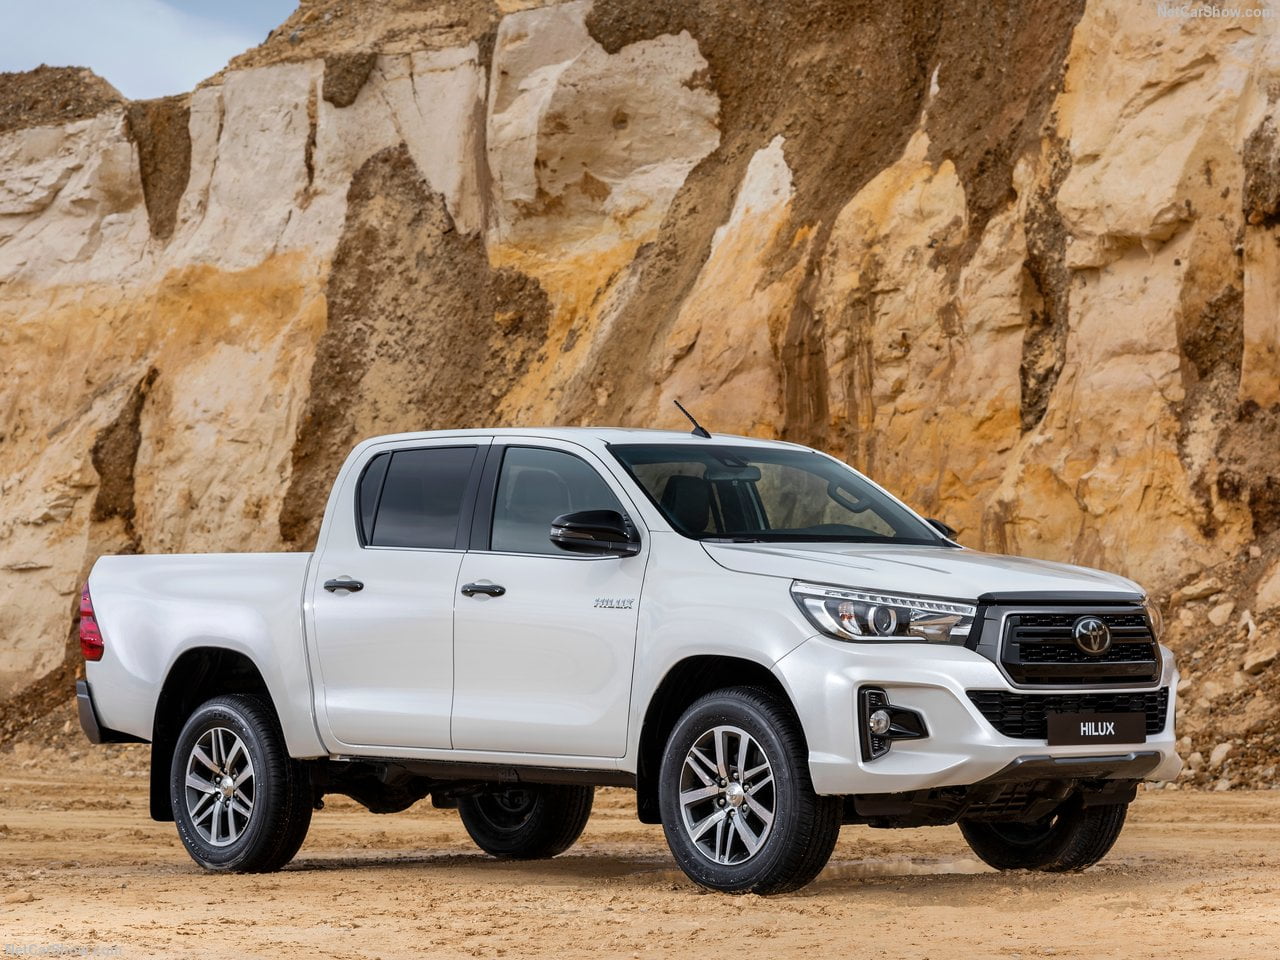
Asean best selling cars in 2019 was again the Toyota Hilux, widening the gap from the main follower, the Isuzu D-Max, which fell 9.2%. The Mitsubishi Xpander and the Toyota Rush landed respectively in 3rd and 6th place, while the best 10 brand was the Toyota Agya, soaring 142.2%.
Association of Southeast Asian Nations (ASEAN) is an economic free trade area in South Asian, including the following nations: Thailand, Philippines, Vietnam, Indonesia, Malaysia, Brunei, Laos, Myanmar and Cambodia.
Economic Environment
ASEAN regional economy has grown less than anticipated, resulting in slight downward revisions to growth forecasts which now stand at 4.8 percent (2019) and 4.9 percent (2020), down from 4.9 percent and 5.0 percent, respectively. Meanwhile, regional inflation for 2019 was expected to fall to 2.4 percent from the previous forecast of 2.6 percent.
Best Selling Cars
With regard to the regional best-selling cars ranking, in 2019 the leadership was still in the hands of the Toyota Hilux, produced in Thailand, well ahead of the list with 6.3% of share, gaining 5.8% from the previous year .
In second place with a growing gap to the leader, the Isuzu D-Max, produced in Thailand as well, holding 4.8% while losing 9.2%.
Third was the Mitsubishi Xpander with 3.8% of share followed by the Toyota Avanza with 3.1% and the Toyota Vios – up 2 spots – with 2.8%.
In sixth place the Toyota Rush with 2.6% followed by the Perodua Myvi with 2.5%.
The Toyota Agya landed in 8th place with a stunning performance, ending at 2.5%, ahead of the Ford Ranger with 2.6% and the Toyota Fortuner with 2.4%.
| Rank 2019 | Rank 2018 | Model | Sales 2019 | 2019 Var |
|---|---|---|---|---|
| 1 | 1 | Toyota Hilux | 203.523 | 5,8% |
| 2 | 2 | Isuzu D-Max | 155.747 | -9,2% |
| 3 | 5 | Mitsubishi Xpander | 123.611 | 31,4% |
| 4 | 3 | Toyota Avanza | 102.464 | 5,8% |
| 5 | 7 | Toyota Vios | 91.659 | 6,1% |
| 6 | 13 | Toyota Rush | 82.721 | 27,5% |
| 7 | 10 | Perodua Myvi | 81.966 | -0,2% |
| 8 | 32 | Toyota Agya | 79.631 | 142,2% |
| 9 | 9 | Ford Ranger | 79.350 | -3,9% |
| 10 | 11 | Toyota Fortuner | 77.585 | -2,0% |
| 11 | 60 | Honda Brio | 76.554 | 458,9% |
| 12 | 8 | Honda City | 74.844 | -13,1% |
| 13 | 6 | Honda HR-V | 68.770 | -23,6% |
| 14 | 12 | Perodua Axia | 67.267 | -5,0% |
| 15 | 24 | Suzuki Carry Pick Up | 65.118 | 44,1% |
| 16 | 517 | TOYOTA Kijang | 57.225 | |
| 17 | 17 | Daihatsu Sigra | 52.283 | 2,7% |
| 18 | 21 | Toyota Yaris | 51.877 | 8,7% |
| 19 | 20 | Mitsubishi Triton | 49.970 | 2,8% |
| 20 | 18 | Mazda2 | 47.119 | -7,3% |
| 21 | 16 | Honda Jazz | 47.062 | -11,1% |
| 22 | 19 | Perodua Bezza | 45.656 | -8,5% |
| 23 | 25 | Honda CR-V | 44.675 | -0,1% |
| 24 | 23 | Nissan Navara | 41.414 | -8,9% |
| 25 | 28 | Suzuki Ertiga | 41.106 | -2,8% |
| 26 | 26 | Honda Civic | 39.453 | -8,2% |
| 27 | 74 | Mitsubishi L300 | 39.096 | 318,3% |
| 28 | 46 | Proton Saga | 38.153 | 90,1% |
| 29 | 27 | Daihatsu Gran Max PU | 35.926 | -15,5% |
| 30 | 29 | Nissan Almera | 35.673 | -9,8% |
| 31 | 31 | Mitsubishi Pajero Sport | 31.809 | -10,7% |
| 32 | 4 | Toyota Innova | 31.144 | -67,1% |
| 33 | 38 | Toyota Hiace | 28.717 | 6,2% |
| 34 | 33 | Toyota Yaris Ativ | 28.072 | -13,4% |
| 35 | 44 | Toyota Wigo | 26.728 | 25,9% |
| 36 | 30 | Toyota Corolla | 25.225 | -31,6% |
| 37 | 34 | Daihatsu Terios | 22.964 | -27,0% |
| 38 | 39 | Daihatsu Ayla | 22.108 | -18,0% |
| 39 | 45 | Proton Persona | 21.876 | 4,0% |
| 40 | 35 | Daihatsu Xenia | 21.674 | -26,6% |
| 41 | 63 | Toyota Camry | 20.979 | 63,7% |
| 42 | 37 | Mazda CX-5 | 20.518 | -25,2% |
| 43 | 48 | Ford Everest | 19.257 | 2,4% |
| 44 | 36 | Honda Mobilio | 18.425 | -34,5% |
| 45 | 47 | Mitsubishi Attrage | 17.346 | -9,7% |
| 46 | 324 | Isuzu NMR | 16.402 | 16809,3% |
| 47 | 67 | Wuling Confero | 16.332 | 39,9% |
| 48 | 15 | Perodua Alza | 16.200 | -71,8% |
| 49 | 40 | Honda BR-V | 15.861 | -39,7% |
| 50 | 54 | Proton Iriz | 15.846 | -0,3% |


