Puerto Rico Vehicle Market in the 2017 was hit by the devastating hurricanes Maria and Irma effects and by the weak US investment in the emergency disaster funds. Toyota is near 30% of market share and customers dislike American products.
Puerto Rico economy remains in weak shape amid high public debt and the fallout from Hurricanes Maria and Irma. On 24 January, the government released a revised five-year fiscal plan. It includes subsidy cuts, reforms to build a more centralized government procurement system and measures to boost tax collection. Despite all of this, the plan projects the government will remain in a fiscal deficit position until FY 2022. In response, Puerto Rico’s financial oversight board requested amendments on 5 February, calling for more details on policy changes and the inclusion of an emergency disaster fund.
Puerto Rico Vehicles Market hit the all time record in the 2013, when light vehicles exceeded the 100k for the second time in the history. Then, the market declined to 80k and the troubles generated by the devastating hurricanes effected the 2017 result.
| Sales 2012 | Sales 2013 | Sales 2014 | Sales 2015 | Sales 2016 | Sales 2017 | Sales 2018 e | |
|---|---|---|---|---|---|---|---|
| Car+LCV | 100.431 | 100.662 | 89.066 | 80.767 | 88.136 | 85.706 | 88.704 |
| 2012 Var | 2013 Var | 2014 Var | 2015 Var | 2016 Var | 2017 Var | 2018 var e | |
|---|---|---|---|---|---|---|---|
| Car+LCV | 12,6% | 0,2% | -11,5% | -9,3% | 9,1% | -2,8% | 3,5% |
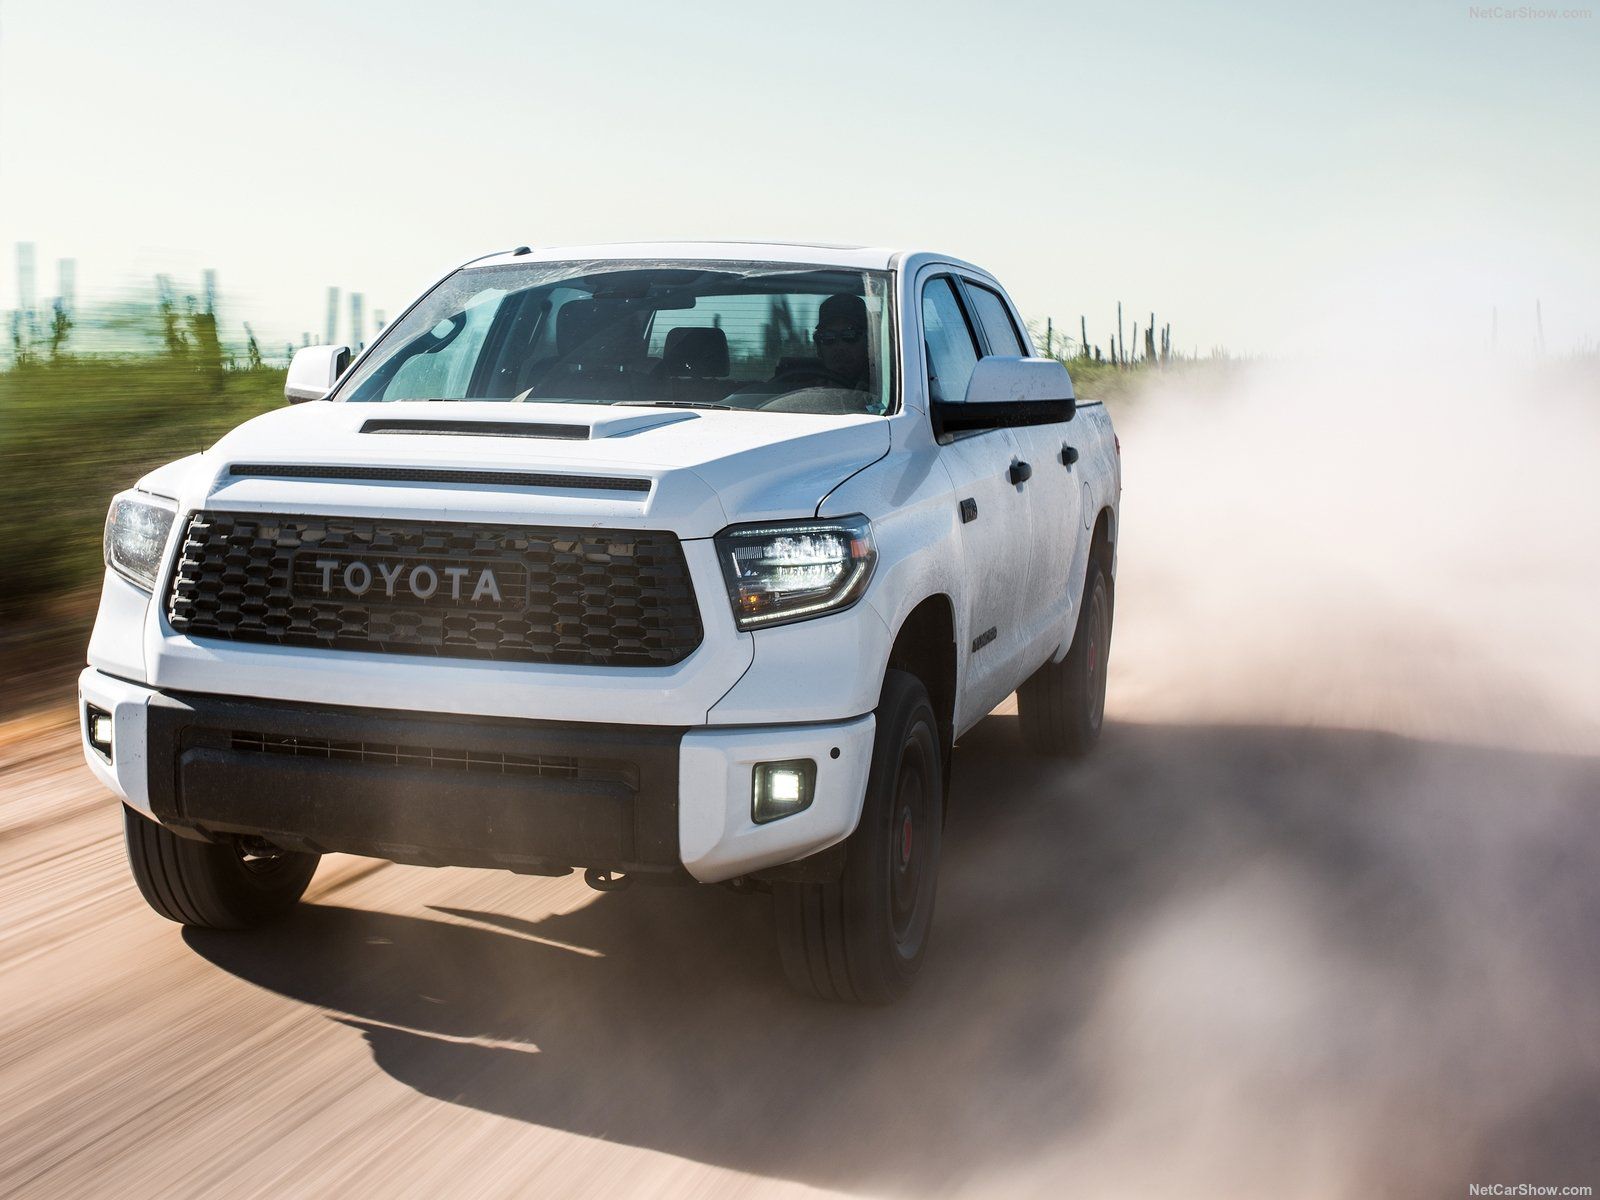
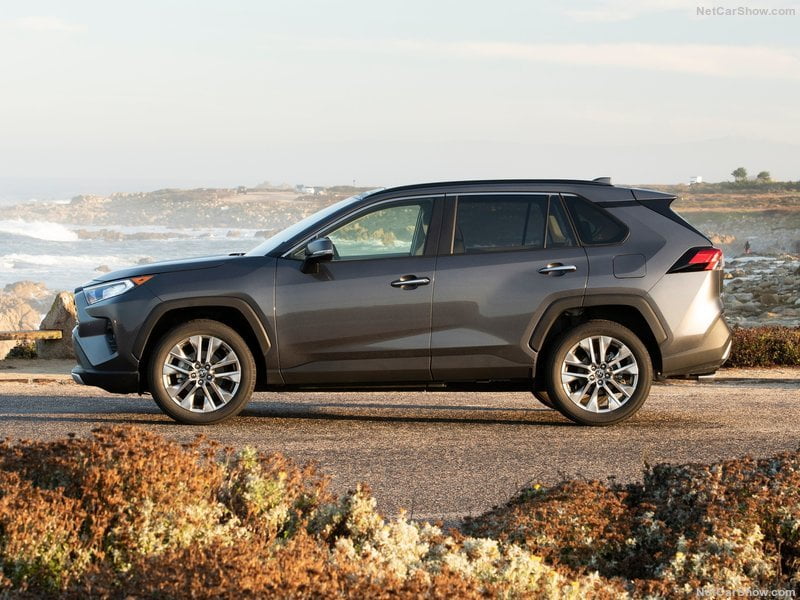
The top-selling brand was Toyota with 24.997 sales (+7.3%) and 29.2% of market share.
In second place Hyundai with 11.334 (-2.6%) followed by Nissan with 8.104 (-7.1%), Kia with 7.511 (+26.2%) and then, the first “American” brand, Jeep, with 5.974 (-9.4%).
| Rank 2017 | Rank 2016 | Brand | Sales 2017 | Sales 2016 | Variation 2017 | Share 2017 | Share 2016 |
|---|---|---|---|---|---|---|---|
| 1 | 1 | Toyota | 24.997 | 23.293 | 7,3% | 29,2% | 26,4% |
| 2 | 2 | Hyundai | 11.334 | 11.634 | -2,6% | 13,2% | 13,2% |
| 3 | 4 | Nissan | 8.104 | 8.724 | -7,1% | 9,5% | 9,9% |
| 4 | 3 | Kia | 7.511 | 8.842 | -15,1% | 8,8% | 10,0% |
| 5 | 8 | Mitsubishi | 6.002 | 4.757 | 26,2% | 7,0% | 5,4% |
| 6 | 5 | Jeep | 5.974 | 6.592 | -9,4% | 7,0% | 7,5% |
| 7 | 6 | Ford | 5.943 | 6.175 | -3,8% | 6,9% | 7,0% |
| 8 | 7 | Honda | 4.887 | 4.864 | 0,5% | 5,7% | 5,5% |
| 9 | 9 | Mazda | 1.351 | 1.845 | -26,8% | 1,6% | 2,1% |
| 10 | 12 | Ram | 1.275 | 1.084 | 17,6% | 1,5% | 1,2% |
| 11 | 10 | Mercedes | 1.045 | 1.354 | -22,8% | 1,2% | 1,5% |
| 12 | 13 | Lexus | 981 | 1.076 | -8,8% | 1,1% | 1,2% |
| 13 | 11 | BMW | 952 | 1.206 | -21,1% | 1,1% | 1,4% |
| 14 | 14 | Chevrolet | 787 | 1.067 | -26,2% | 0,9% | 1,2% |
| 15 | 15 | Acura | 663 | 821 | -19,2% | 0,8% | 0,9% |
| 16 | 17 | Dodge | 596 | 658 | -9,4% | 0,7% | 0,7% |
| 17 | 20 | Volkswagen | 567 | 447 | 26,8% | 0,7% | 0,5% |
| 18 | 18 | Infiniti | 553 | 549 | 0,7% | 0,6% | 0,6% |
| 19 | 19 | Mini | 436 | 527 | -17,3% | 0,5% | 0,6% |
| 20 | 22 | Audi | 264 | 252 | 4,9% | 0,3% | 0,3% |
| 21 | 21 | Fiat | 257 | 308 | -16,6% | 0,3% | 0,3% |
| 22 | 23 | Porsche | 187 | 238 | -21,3% | 0,2% | 0,3% |
| 22 | 24 | Land Rover | 187 | 220 | -15,0% | 0,2% | 0,2% |
| 23 | 25 | Chrysler | 182 | 217 | -16,1% | 0,2% | 0,2% |
| 23 | 29 | Volvo | 182 | 59 | 208,5% | 0,2% | 0,1% |
| 24 | 26 | Subaru | 136 | ||||
| 25 | 27 | Lincoln | 88 | ||||
| 26 | 28 | GMC | 50 | ||||
| 27 | 36 | Alfa Romeo | 48 | ||||
| 27 | 31 | Jaguar | 48 | ||||
| 28 | 34 | Maserati | 34 | ||||
| 29 | 32 | Cadillac | 32 | ||||
| 30 | 33 | Buick | 23 | ||||
| 30 | 30 | Smart | 23 | ||||
| 31 | 35 | Ferrari | 6 | ||||
| 32 | 16 | Scion | 1 |
| Rank 2017 | Rank 2016 | Group | Sales 2017 | Sales 2016 | Variation 2017 | Share 2017 | Share 2016 |
|---|---|---|---|---|---|---|---|
| 1 | 1 | Toyota M.C. | 25.979 | 25.166 | 3,2% | 30,3% | 28,6% |
| 2 | 2 | Hyundai-Kia | 18.845 | 20.476 | -8,0% | 22,0% | 23,2% |
| 3 | 3 | Renault Nissan Alliance | 14.659 | 14.030 | 4,5% | 17,1% | 15,9% |
| 4 | 4 | F.C.A. | 8.372 | 8.902 | -6,0% | 9,8% | 10,1% |
| 5 | 5 | Ford M.C. | 6.031 | 6.282 | -4,0% | 7,0% | 7,1% |
| 6 | 6 | Honda M.C. | 5.550 | 5.685 | -2,4% | 6,5% | 6,4% |
| 7 | 8 | BMW | 1.388 | 1.733 | -19,9% | 1,6% | 2,0% |
| 8 | 7 | Mazda | 1.351 | 1.845 | -26,8% | 1,6% | 2,1% |
| 9 | 9 | Mercedes Benz | 1.068 | 1.405 | -24,0% | 1,2% | 1,6% |
| 10 | 11 | Volkswagen Group | 1.018 | 937 | 8,7% | 1,2% | 1,1% |
| Rank 2017 | Rank 2016 | Sales 2017 | Sales 2016 | Variation 2017 | |
|---|---|---|---|---|---|
| 1 | 1 | Toyota Yaris | 6.625 | 7.787 | -14,9% |
| 2 | 2 | Toyota Corolla | 4.047 | 4.590 | -11,8% |
| 3 | 3 | Toyota Tacoma | 3.962 | 3.614 | 9,6% |
| 4 | 4 | Hyundai Elantra | 3.509 | 3.305 | 6,2% |
| 5 | 7 | Mitsubishi Mirage | 2.878 | 2.214 | 30,0% |
| 6 | 6 | Hyundai Accent | 2.794 | 3.131 | -10,8% |
| 7 | 5 | Kia Rio | 2.005 | 3.156 | -36,5% |
| 8 | 11 | Ford F-Series | 1.640 | 1.007 | 62,9% |
| 9 | 22 | Toyota Corolla iM | 1.520 | 419 | 262,8% |
| 10 | 8 | Nissan Sentra | 1.500 | 1.993 | -24,7% |
| 11 | 10 | Ram pick-up | 1.239 | 1.040 | 19,1% |
| 12 | 9 | Kia Forte | 1.123 | 1.297 | -13,4% |
| 13 | 15 | Ford Transit | 872 | 651 | 33,9% |
| 14 | 13 | Honda Civic | 816 | 825 | -1,1% |
| 15 | 14 | Ford Transit connect | 752 | 678 | 10,9% |
| 16 | 12 | Honda Accord | 642 | 914 | -29,8% |
| 17 | 18 | Mitsubishi Lancer | 626 | 538 | 16,4% |
| 18 | 24 | Nissan Frontier | 548 | 381 | 43,8% |
| 19 | 21 | Honda Fit | 435 | 443 | -1,8% |
| 20 | 17 | Hyundai Sonata | 417 | 550 | -24,2% |
| 21 | 26 | Toyota Camry | 401 | 342 | 17,3% |
| 22 | 23 | Ford Mustang | 351 | 389 | -9,8% |
| 23 | 28 | Ford Fiesta | 332 | 328 | 1,2% |
| 24 | 16 | Hyundai Veloster | 289 | 558 | -48,2% |
| 25 | 22 | Mazda2 | 267 | 419 | -36,3% |
| 26 | 29 | Fiat 500 | 257 | 308 | -16,6% |
| 27 | 25 | Mini | 217 | 347 | -37,5% |
| 28 | 34 | Kia Optima | 209 | 219 | -4,6% |
| 29 | 27 | Mercedes C Class | 199 | 330 | -39,7% |
| 30 | 33 | BMW 3 Series | 177 | 233 | -24,0% |


