Best selling Cars in Italy in the 2017 dominated by the Fiat Panda with a wide gap over the Lancia Ypsilon and the Fiat Tipo. The leader among imported vehicles was the Renault Clio ahead of a raising star, the last generation of Citroen C3.
Best selling car ranking in Italy has always been a feud of Fiat, a brand holding over 20% of market share. Mirroring the sales distribution by class, on top of the list there are all city and small cars and in the final 2016 ranking, there was only one C class car within the top 10.
In the 2017, while the total market is growing faster than expected, the ranking of top 50 models has not dramatically changed, considering the low-level of new models introduced in the market so far.
In the 2017, the best-selling car in the market was, for the 6th consecutive, the city-car Fiat Panda with 146.033 sales (-0.6%), followed by the Lancia Ypsilon with 60.320 units (-8.1%) and the Fiat Tipo with 56.049 (+77.6%).
In fourth place the Fiat 500 with 43.963 (+18.9%) ahead of the leader of imported vehicles, the Renault Clio with 52.629 units (+5.7%), the Citroen C3 with 48.667 (+55.6%), the Fiat 500L with 46.459 (-14.9%).
In eight place the Fiat 500X with 45.793 (-0.9%) followed by the Volkswagen Golf with 41.829 units (-10.4%) and the Ford Fiesta with 41.289 units (-5.2%).
Research, Consulting, Data & Forecast Store
F2M covers intensively this market with several products developed to help any investigation required. Market Researches in PDF are immediately available for download with study on the market since 2005 and with forecast up to the 2022. Auto Data in EXCEL are immediately downloadable with annual sales volume, split by month, for all brands and all models distributed in the market. This year data are released year to date, but you will receive a monthly update until the year-end. All these and more within Italy Store!
| Rank 2017 | Rank 2016 | Model | Sales 2017 | Sales 2016 | Variation 2017 |
|---|---|---|---|---|---|
| 1 | 1 | Fiat Panda | 146.033 | 147.283 | -0,8% |
| 2 | 2 | Lancia Ypsilon | 60.320 | 65.663 | -8,1% |
| 3 | 14 | Fiat Tipo | 56.049 | 31.555 | 77,6% |
| 4 | 7 | Fiat 500 | 53.963 | 45.400 | 18,9% |
| 5 | 4 | Renault Clio | 52.629 | 49.798 | 5,7% |
| 6 | 15 | Citroen C3 | 48.667 | 31.274 | 55,6% |
| 7 | 3 | Fiat 500L | 46.459 | 54.578 | -14,9% |
| 8 | 6 | Fiat 500x | 45.793 | 46.232 | -0,9% |
| 9 | 5 | Volkswagen Golf | 41.829 | 46.708 | -10,4% |
| 10 | 9 | Ford Fiesta | 41.289 | 43.573 | -5,2% |
| 11 | 10 | Volkswagen Polo | 39.498 | 43.096 | -8,3% |
| 12 | 12 | Jeep Renegade | 37.638 | 34.331 | 9,6% |
| 13 | 8 | Fiat Punto | 37.261 | 45.208 | -17,6% |
| 14 | 13 | Toyota Yaris | 36.948 | 32.110 | 15,1% |
| 15 | 11 | Peugeot 208 | 36.712 | 34.793 | 5,5% |
| 16 | 17 | Nissan Qashqai | 31.350 | 28.823 | 8,8% |
| 17 | 18 | Renault Captur | 29.901 | 28.255 | 5,8% |
| 18 | 31 | Volkswagen Tiguan | 29.167 | 15.400 | 89,4% |
| 19 | 16 | Opel Corsa | 28.796 | 30.508 | -5,6% |
| 20 | 20 | Opel Mokka | 28.133 | 23.799 | 18,2% |
| 21 | 24 | Dacia Sandero | 27.658 | 20.693 | 33,7% |
| 22 | 23 | Dacia Duster | 24.572 | 22.370 | 9,8% |
| 23 | 21 | Peugeot 2008 | 23.374 | 23.369 | 0,0% |
| 24 | 19 | Alfa Romeo Giulietta | 20.907 | 23.831 | -12,3% |
| 25 | 22 | Hyundai Tucson | 20.871 | 22.893 | -8,8% |
| 26 | 28 | Ford Ecosport | 19.247 | 17.199 | 11,9% |
| 27 | 43 | Ford Kuga | 18.194 | 11.584 | 57,1% |
| 28 | 25 | Smart Fortwo | 18.012 | 19.477 | -7,5% |
| 29 | 29 | Kia Sportage | 16.964 | 16.613 | 2,1% |
| 30 | 84 | Peugeot 3008 | 16.856 | 5.165 | 226,4% |
| 31 | 40 | Nissan Micra | 16.852 | 11.934 | 41,2% |
| 32 | Toyota C-HR | 16.616 | |||
| 33 | 39 | Volkswagen Up! | 16.206 | 12.081 | 34,1% |
| 34 | 37 | Hyundai i10 | 15.739 | 13.440 | 17,1% |
| 35 | 26 | Peugeot 308 | 15.425 | 19.396 | -20,5% |
| 36 | 30 | Mercedes A Class | 14.909 | 16.349 | -8,8% |
| 37 | 32 | Renault Kadjar | 14.654 | 15.151 | -3,3% |
| 38 | 27 | Audi A3 | 14.156 | 17.837 | -20,6% |
| 39 | 34 | Ford Focus | 14.136 | 14.396 | -1,8% |
| 40 | 55 | Renault Mégane | 14.057 | 9.567 | 46,9% |
| 41 | 46 | BMW X1 | 13.342 | 10.841 | 23,1% |
| 42 | 36 | Toyota Aygo | 12.919 | 13.465 | -4,1% |
| 43 | 33 | Ford C-Max | 12.148 | 14.399 | -15,6% |
| 44 | 52 | Mini | 11.770 | 9.947 | 18,3% |
| 45 | 61 | BMW 1 Series | 11.471 | 8.552 | 34,1% |
| 46 | 35 | Audi A4 | 11.437 | 14.067 | -18,7% |
| 47 | Audi Q2 | 11.045 | |||
| 48 | 51 | Opel Karl | 10.840 | 9.970 | 8,7% |
| 49 | 99 | Renault Scénic | 10.608 | 3.200 | 231,5% |
| 50 | 47 | Hyundai i20 | 10.476 | 10.803 | -3,0% |
| 51 | 38 | Opel Astra | 10.177 | 13.251 | -23,2% |
| 52 | 44 | Kia Rio | 10.004 | 11.542 | -13,3% |
| 53 | 57 | Citroen C4 | 9.956 | 9.303 | 7,0% |
| 54 | 63 | Ford B-Max | 9.946 | 8.513 | 16,8% |
| 55 | 41 | BMW 2 Series | 9.893 | 11.832 | -16,4% |
| 56 | 88 | Alfa Romeo Giulia | 9.774 | 4.628 | 111,2% |
| 57 | 64 | Skoda Octavia | 9.677 | 8.271 | 17,0% |
| 58 | 42 | Audi Q3 | 9.620 | 11.634 | -17,3% |
| 59 | 120 | Ford Ka+ | 9.432 | 2.253 | 318,6% |
| 60 | 53 | Land Rover Range Rover Evoque | 9.189 | 9.901 | -7,2% |
| 61 | 50 | Mini Countryman | 9.029 | 10.083 | -10,5% |
| 62 | 184 | Suzuki Ignis | 8.941 | 610 | 1365,7% |
| 63 | 49 | Toyota Auris | 8.790 | 10.328 | -14,9% |
| 64 | 58 | Smart Forfour | 8.654 | 8.933 | -3,1% |
| 65 | 48 | BMW 3 Series | 8.652 | 10.499 | -17,6% |
| 66 | 54 | Renault Twingo | 8.531 | 9.598 | -11,1% |
| 67 | 45 | Volkswagen Passat | 8.527 | 10.929 | -22,0% |
| 68 | 62 | Mercedes GLA | 8.460 | 8.541 | -0,9% |
| 69 | 71 | Skoda Fabia | 8.175 | 7.094 | 15,2% |
| 70 | 59 | Mercedes C Class | 8.062 | 8.869 | -9,1% |
| 71 | 86 | Kia Picanto | 7.938 | 4.896 | 62,1% |
| 72 | 68 | Toyota RAV4 | 7.833 | 7.706 | 1,6% |
| 73 | 56 | Mercedes B Class | 7.772 | 9.440 | -17,7% |
| 74 | 65 | Citroen C1 | 7.730 | 8.102 | -4,6% |
| 75 | Jeep Compass | 7.668 | |||
| 76 | 54 | Suzuki Vitara | 7.621 | 9.598 | -20,6% |
| 77 | 60 | Nissan Juke | 7.291 | 8.554 | -14,8% |
| 78 | 92 | Audi Q5 | 7.240 | 4.241 | 70,7% |
| 79 | 66 | Citroen C4 Cactus | 7.086 | 8.031 | -11,8% |
| 80 | 67 | Alfa Romeo MiTo | 7.064 | 7.734 | -8,7% |
| 81 | 78 | Nissan X-Trail | 6.888 | 5.658 | 21,7% |
| 82 | 69 | Peugeot 108 | 6.803 | 7.457 | -8,8% |
| 83 | 75 | Hyundai ix20 | 6.565 | 6.227 | 5,4% |
| 84 | 107 | Mercedes E Class | 6.015 | 2.704 | 122,4% |
| 85 | 70 | Land Rover Discovery Sport | 5.951 | 7.197 | -17,3% |
| 86 | Opel Crossland X | 5.676 | |||
| 87 | 72 | Audi A1 | 5.670 | 6.910 | -17,9% |
| 88 | 77 | Mercedes GLC | 5.602 | 5.795 | -3,3% |
| 89 | 79 | Seat Ibiza | 5.562 | 5.589 | -0,5% |
| 90 | 76 | Seat Leon | 5.430 | 5.950 | -8,7% |
| 91 | 82 | Volvo V40 | 5.426 | 5.386 | 0,7% |
| 92 | 74 | Opel Adam | 5.169 | 6.305 | -18,0% |
| 93 | 83 | Mercedes CLA | 4.665 | 5.267 | -11,4% |
| 94 | 94 | BMW 5 Series | 4.624 | 3.974 | 16,4% |
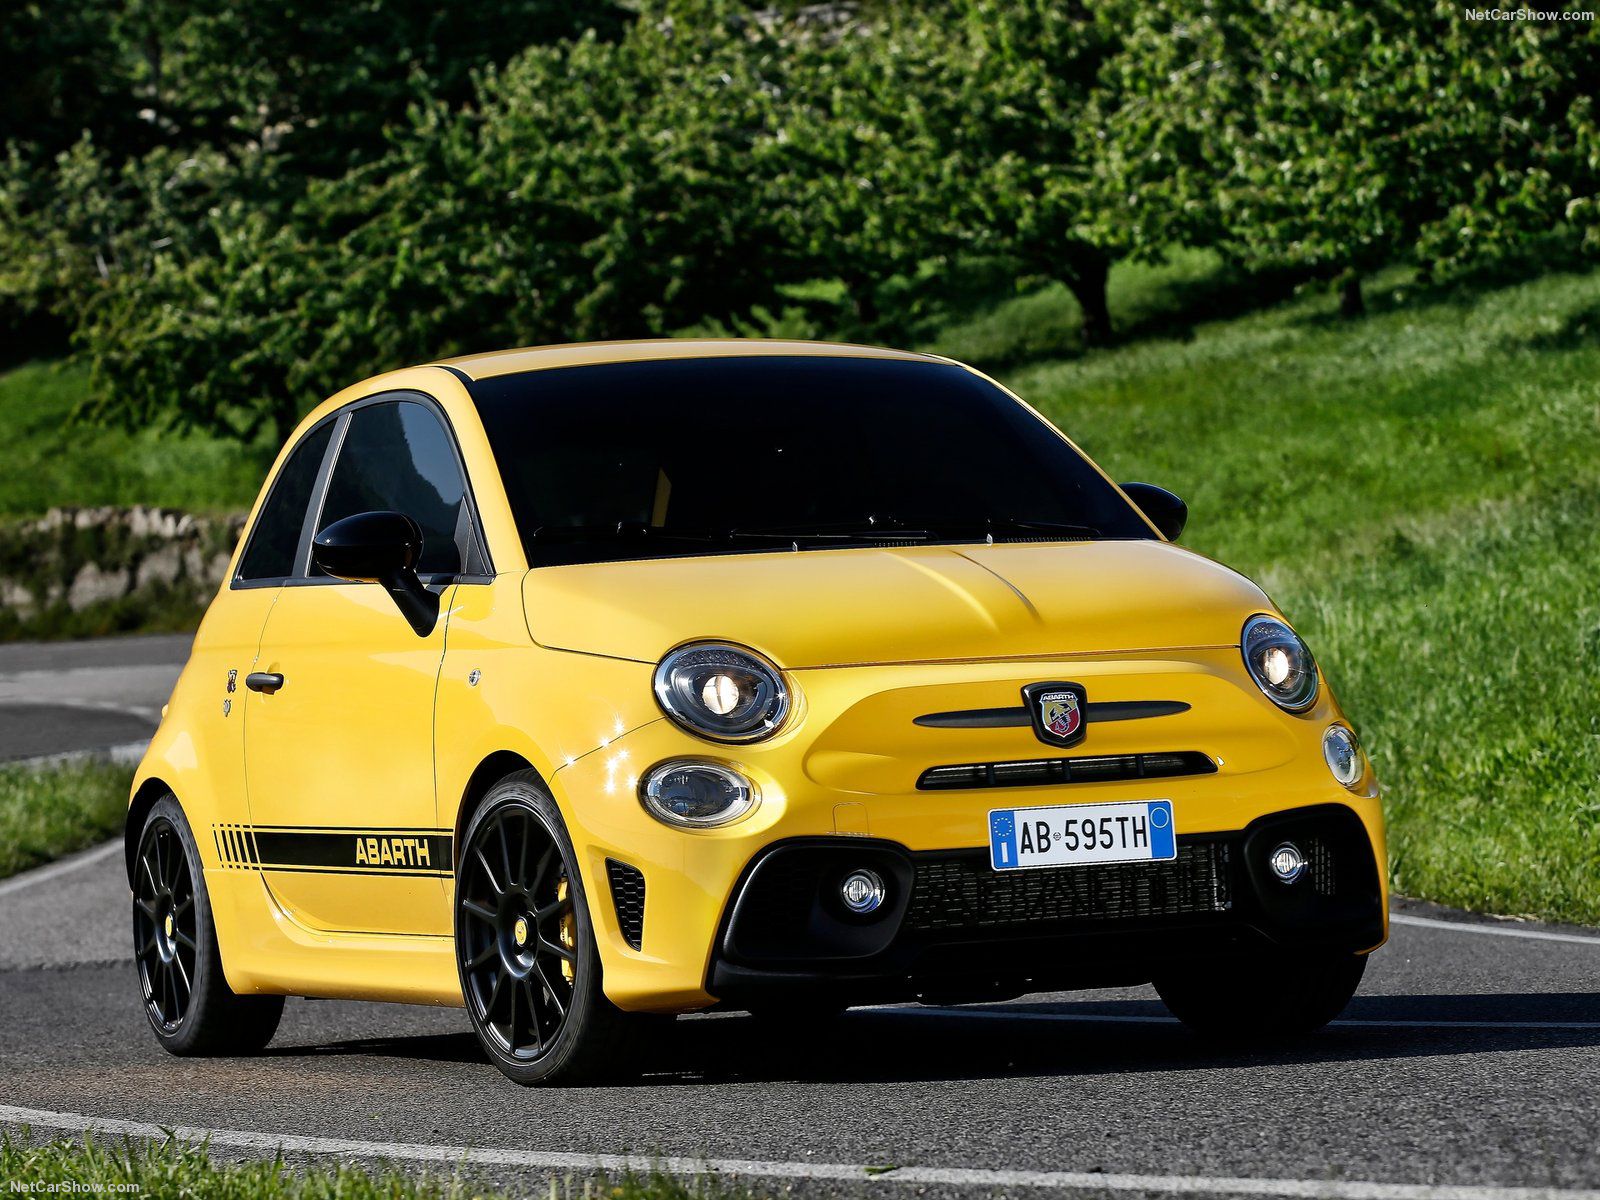
| 95 | 95 | Abarth 595 | 4.571 | 3.792 | 20,5% |
| 96 | 73 | Opel Meriva | 4.558 | 6.400 | -28,8% |
| 97 | 91 | Volvo XC60 | 4.338 | 4.370 | -0,7% |
| 98 | 151 | Seat Ateca | 4.205 | 1.200 | 250,4% |
| 99 | 81 | Audi A6 | 4.027 | 5.429 | -25,8% |
| 100 | 80 | Mini Clubman | 3.874 | 5.431 | -28,7% |
| 101 | 90 | Kia Venga | 3.837 | 4.372 | -12,2% |


