Bosnian vehicles market in 2019 has reported the 6th consecutive growing year. Indeed, Total sales have been 9.866, up 1.8% from the previous year. Skoda held 18.1% of share, increasing the gap from Volkswagen, which declined by 28.6%. Dacia gained the market podium.
Economic Environment
Bosnian economic growth was likely tepid in H2, after slowing throughout the first half of 2019, although comprehensive data is still outstanding. Industrial production slumped in July–November, amid ongoing manufacturing sector weakness, while exports fell sharply in the same period.
More positively, unemployment dropped in July–October compared with H1, while wages increased over the same period, boding well for private consumption.
Market Trend
Bosnian vehicles market in recent years has recovered following the deep fall scored in the 2008-2009 crisis. In the last five years annual sales volume grew up from 6.514 in the 2014 to 8.870 in the 2016, recovering the 2013 fall. In the 2017, light vehicles sales have been 10.803, up 21.8%, keeping a positive score trend also during the 2018, when regstrations grew 1.1% at 9.690.
In 2019, the market held a positive trend. Indeed, Total sales have been 9.866, up 1.8% from the previous year.
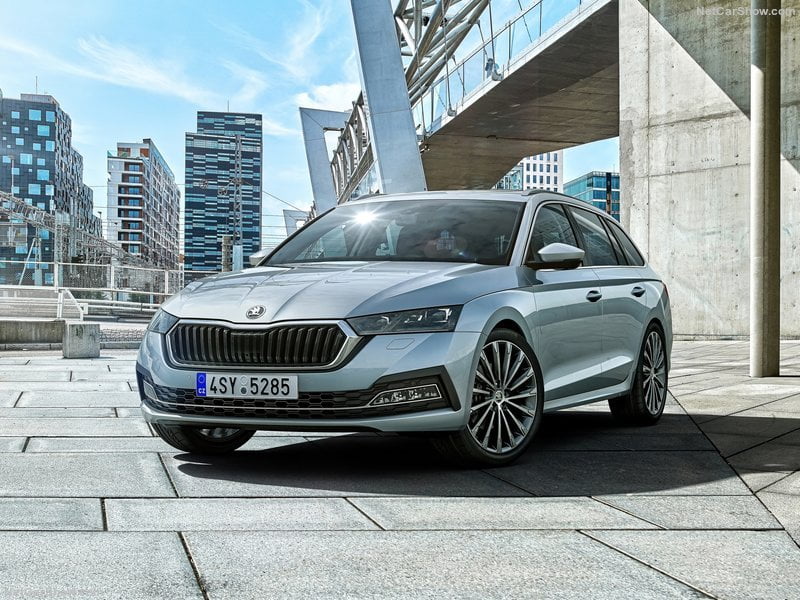
In the competitive landscape, Skoda has been the undisputed leader for the entire decade, except during 2014, when Volkswagen outpaced the historic leader. However, in 2019, Skoda kept leading the market with 18.1% of share, recovering almost 2 points after the 2017’s sharp drop.
Volkswagen ended to to a negative peak of 11.2% of share – losing near 7 points from 2014 – reporting the worst performance in the Top 10. Meanwhile, Dacia gained the market podium, growing from 4.4% of share in 2012 to 7.8%.
Service Solutions
Since 2010, focus2move.com is a specialist in the automotive industry tracking monthly sales for all brands and models in the widest in the World range of countries, actually over 150. From this huge database we can extract data sorted under your own conditions and deliver historical data in excel.
If you like to receive historical data or to subscribe at monthly update, contact us at kventura@focus2move.com and we will arrange a short video call. By showing you our database and segmentation, we can find together the best solutions for your team.
| Rank 2019 | Rank 2018 | Brand | Sales 2019 | Sales December | +/- YTD | Share 2019 | Share December |
|---|---|---|---|---|---|---|---|
| 1 | 1 | Skoda | 1.787 | 83 | -1,2% | 18,11% | 11,25% |
| 2 | 2 | Volkswagen | 1.105 | 67 | -28,6% | 11,20% | 9,08% |
| 3 | 4 | Dacia | 772 | 73 | 19,9% | 7,82% | 9,89% |
| 4 | 3 | Opel | 692 | 65 | -4,0% | 7,01% | 8,81% |
| 5 | 5 | Toyota | 638 | 39 | 4,9% | 6,47% | 5,28% |
| 6 | 6 | Renault | 560 | 100 | 6,9% | 5,68% | 13,55% |
| 7 | 7 | Hyundai | 519 | 45 | 22,7% | 5,26% | 6,10% |
| 8 | 8 | Peugeot | 482 | 58 | 14,2% | 4,89% | 7,86% |
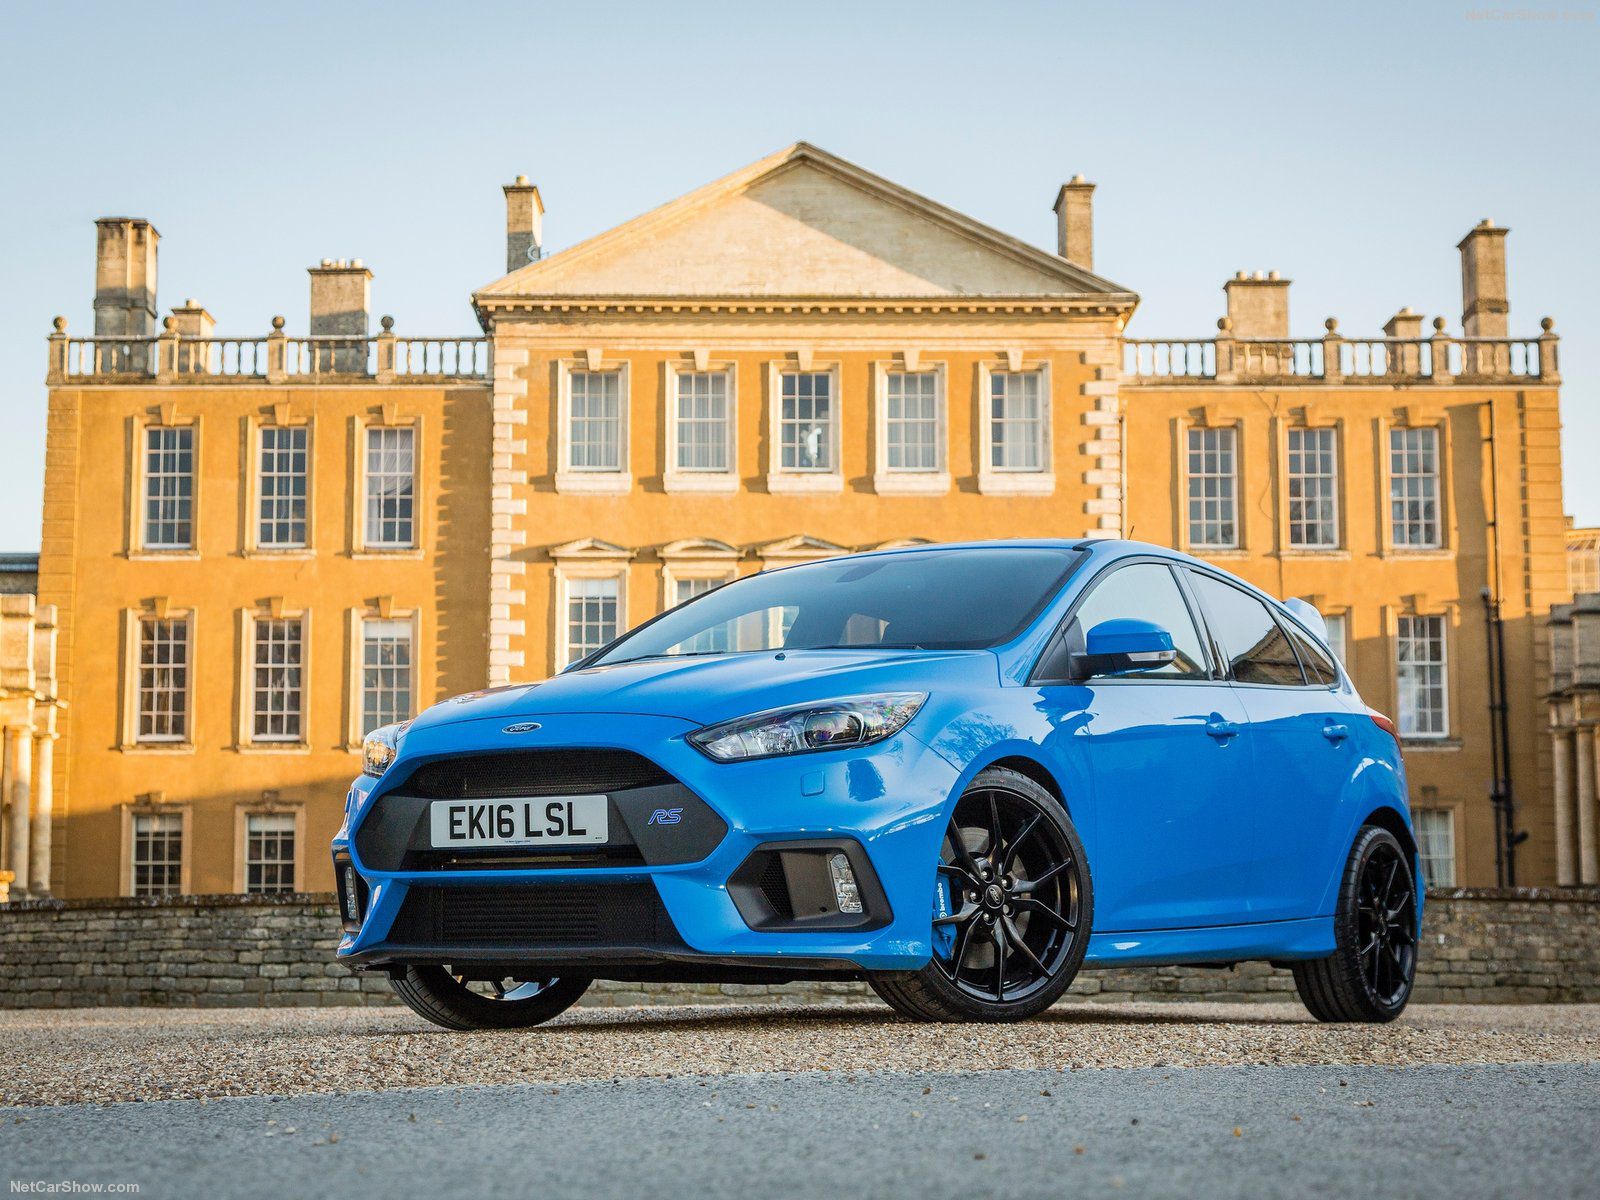
| 9 | 9 | Ford | 469 | 17 | 14,7% | 4,75% | 2,30% |
| 10 | 11 | Audi | 396 | 8 | 18,2% | 4,01% | 1,08% |
| 11 | 10 | Citroen | 385 | 24 | 10,6% | 3,90% | 3,25% |
| 12 | 12 | Mercedes | 300 | 3 | 10,3% | 3,04% | 0,41% |
| 13 | 15 | Seat | 244 | 19 | 34,1% | 2,47% | 2,57% |
| 14 | 13 | Kia | 223 | 26 | -12,2% | 2,26% | 3,52% |
| 15 | 14 | Suzuki | 222 | 5 | -0,4% | 2,25% | 0,68% |
| 16 | 17 | Fiat | 214 | 15 | 28,1% | 2,17% | 2,03% |
| 17 | 18 | BMW | 181 | 27 | 46,0% | 1,83% | 3,66% |
| 18 | 16 | Nissan | 152 | 5 | -11,1% | 1,54% | 0,68% |
| 19 | 19 | Volvo | 142 | 8 | 16,4% | 1,44% | 1,08% |
| 20 | 21 | Porsche | 98 | - | 38,0% | 0,99% | 0,00% |
| 21 | 20 | Lada | 82 | 29 | -29,9% | 0,83% | 3,93% |
| 22 | 22 | Mazda | 76 | 18 | 26,7% | 0,77% | 2,44% |
| 23 | 23 | Land Rover | 60 | 3 | 17,6% | 0,61% | 0,41% |
| 24 | 24 | Jeep | 25 | - | -39,0% | 0,25% | 0,00% |
| 25 | 26 | Jaguar | 24 | 1 | 20,0% | 0,24% | 0,14% |
| 26 | 25 | Alfa Romeo | 13 | - | -38,1% | 0,13% | 0,00% |
| 27 | 28 | Mitsubishi | 3 | - | 0,03% | 0,00% | |
| 28 | 27 | Mini | 1 | - | -50,0% | 0,01% | 0,00% |
| 28 | 27 | Infiniti | 1 | - | -50,0% | 0,01% | 0,00% |
| Rank 2019 | Rank 2018 | Group | Sales 2019 | Sales December | +/- 2019 | Share 2019 | Share December |
|---|---|---|---|---|---|---|---|
| 1 | 1 | Volkswagen Group | 3.630 | 177 | -8,0% | 36,79% | 23,98% |
| 2 | 3 | Renault Nissan Alliance | 1.570 | 207 | 7,7% | 15,91% | 28,05% |
| 3 | 2 | P.S.A. | 1.559 | 147 | 4,6% | 15,80% | 19,92% |
| 4 | 4 | Hyundai-Kia | 742 | 71 | 9,6% | 7,52% | 9,62% |
| 5 | 5 | Toyota Group | 638 | 39 | 4,9% | 6,47% | 5,28% |
| 6 | 6 | Ford Group | 469 | 17 | 14,7% | 4,75% | 2,30% |
| 7 | 7 | Mercedes Daimler | 300 | 3 | 10,3% | 3,04% | 0,41% |
| 8 | 8 | F.C.A. | 252 | 15 | 10,0% | 2,55% | 2,03% |
| 9 | 9 | Suzuki | 222 | 5 | -0,4% | 2,25% | 0,68% |
| 10 | 10 | BMW | 182 | 27 | 44,4% | 1,84% | 3,66% |
| Rank 2019 | Rank 2018 | Model | Sales 2019 | 2019 Var |
|---|---|---|---|---|
| 1 | 1 | Skoda Octavia | 856 | 43,9% |
| 2 | 2 | Skoda Fabia | 366 | -32,6% |
| 3 | 7 | Hyundai Tucson | 319 | 30,7% |
| 4 | 3 | Volkswagen Golf | 306 | -28,8% |
| 5 | 5 | Dacia Duster | 301 | 7,5% |
| 6 | 6 | Dacia Sandero | 298 | 15,1% |
| 7 | 13 | Volkswagen Caddy | 277 | 83,4% |
| 8 | 11 | Renault Clio | 256 | 54,2% |
| 9 | 8 | Toyota Yaris | 216 | -4,0% |
| 10 | 10 | Opel Astra | 205 | 17,1% |


