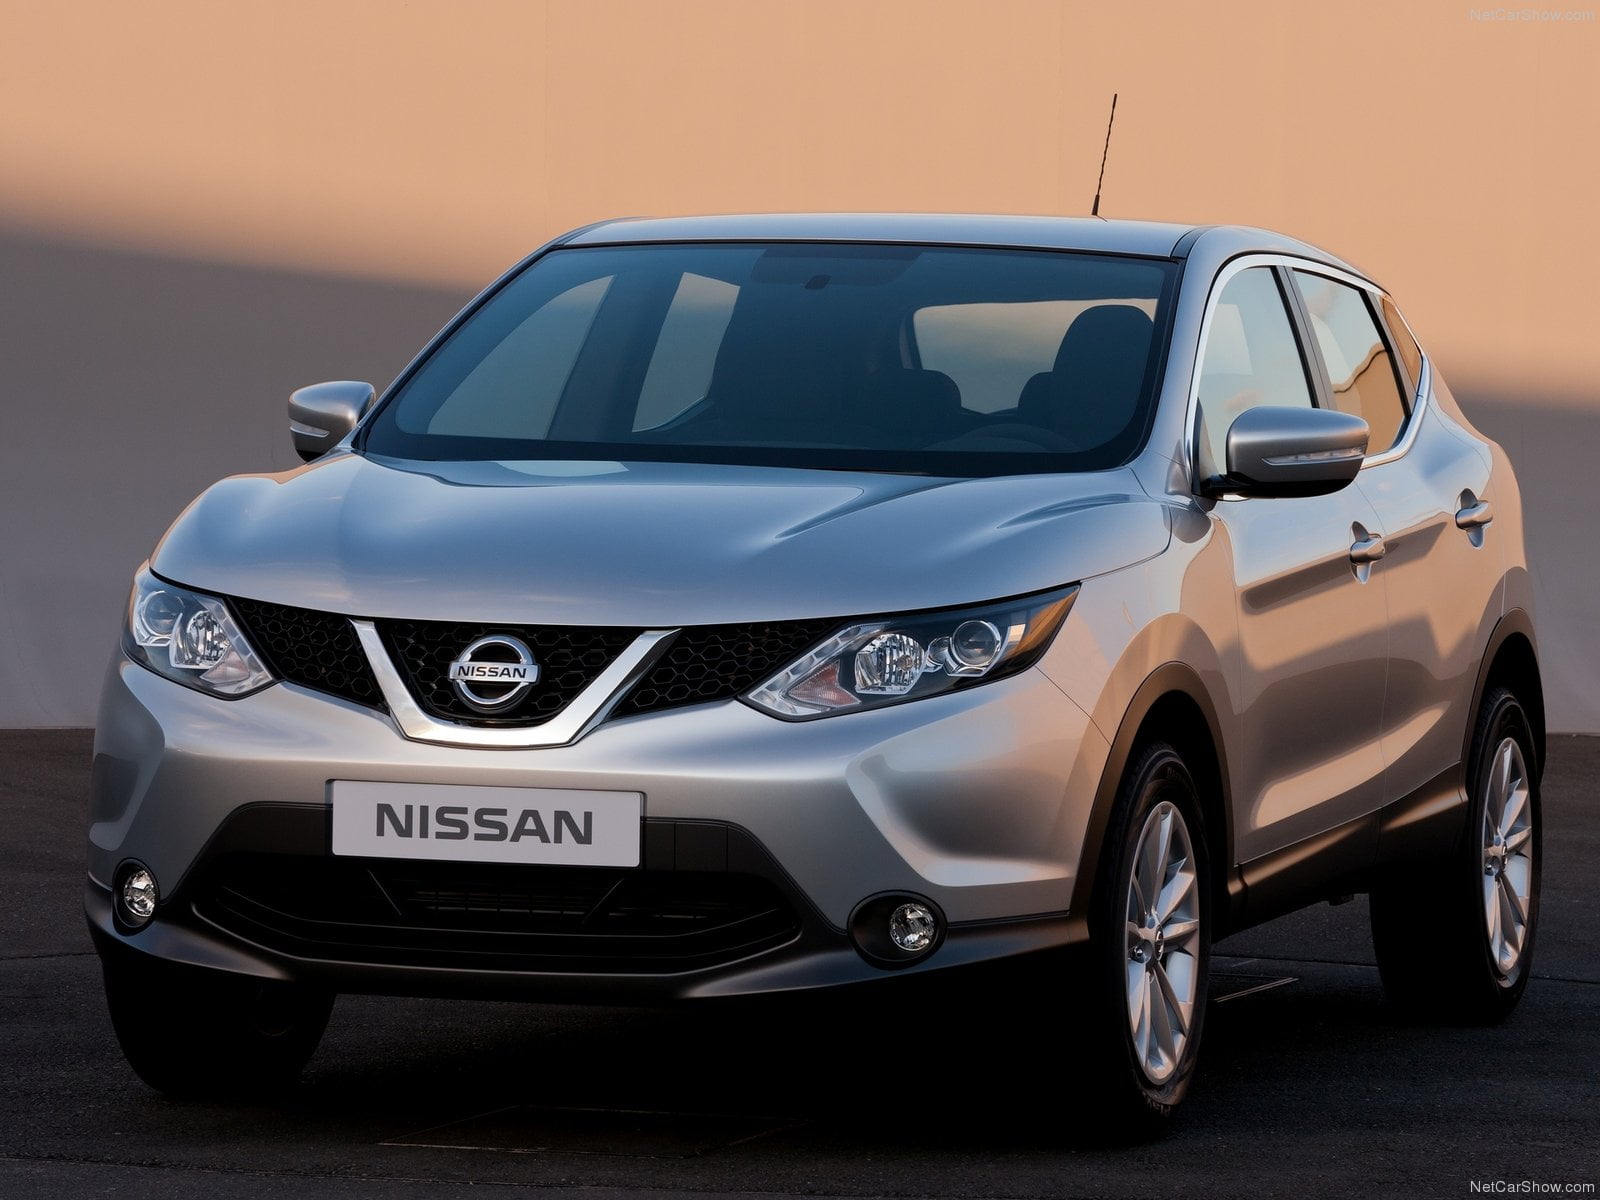
Cyprus car market in the 2014 has broken the five years decline with a shy recovery on the previous year. The market stands at almost low-level, one-third below the 2008 volume. Toyota become market leader outpacing Nissan.
Introducing Cyprus
Cyprus is far more than a lazy beach-time resort; the island is multilayered, like its history, with a compelling culture, lifestyle and landscape, overseen by warm, hospitable people.
Economic Outlook
Cyprus emerged from recession in Q1 and the pace of recovery strengthened in Q2.
The economy grew 1.2% annually in Q2, which marks the largest expansion in over four years and suggests that harsh reforms are beginning to bear results.
In August, the Cabinet approved legislation which brings the privatizing of the telecom provider CyTA one step closer. The approval of the bill forms part of the requirements of Cyprus’ bailout program with its international creditors.
Market Outlook
The vehicles market of Cyprus in the last years has mirrored the economic reality experienced by the country with a rapid development in the period 2004-2008, a sharp fall in 2009 with a series of declining years until the 2013.
Full year volume hit the 27.533 units in the 2008 to decline at 8.011 in the 2013.
In the 2014 a shy recovery was in place with sales grew at 9.423 units.
The market leader was Toyota with 1.098 sales and a share of 13.2% overtaking the former leader, Nissan, declined in second place with 1.066 units and 12.8% of market share. Third was Kia with 623 sales.
The Nissan Qashqai was the best selling model ahead of Toyota Yaris and Ford Fiesta.
Below, you can sort our interactive tables to see data regarding Brands, Groups and Models. Please bear in mind that sales data are subject to adjustments as sources will update their information. This report is updated at the publishing date and will not be modified while the next on this subject will always have the year to date data updated.
| Rank 2014 | Rank 2013 | Brand | Sales 2013 | Sales 2014 | Share 2014 | Share 2013 |
|---|---|---|---|---|---|---|
| 1 | 2 | Toyota | 849 | 1.098 | 13,2% | 12,0% |
| 2 | 1 | Nissan | 948 | 1.066 | 12,8% | 13,3% |
| 3 | 4 | Kia | 594 | 623 | 7,5% | 8,4% |
| 4 | 5 | Volkswagen | 518 | 590 | 7,1% | 7,3% |
| 5 | 3 | Ford | 695 | 484 | 5,8% | 9,8% |
| 6 | 16 | Land Rover | 104 | 470 | 5,6% | 1,5% |
| 7 | 6 | Mercedes | 459 | 469 | 5,6% | 6,5% |
| 8 | 7 | BMW | 381 | 466 | 5,6% | 5,4% |
| 9 | 8 | Renault | 295 | 354 | 4,2% | 4,2% |
| 10 | 12 | Honda | 182 | 326 | 3,9% | 2,6% |
| Rank 2014 | Rank 2013 | Model | Sales 2013 | Sales 2014 | 2014 Var. | Share 2013 | Share 2014 |
|---|---|---|---|---|---|---|---|
| 1 | 2 | Nissan Qashqai | 378 | 395 | 4,5% | 5,3% | 4,7% |
| 2 | 3 | Toyota Yaris | 346 | 384 | 11,0% | 4,9% | 4,6% |
| 3 | 1 | Ford Fiesta | 407 | 320 | -21,4% | 5,7% | 3,8% |
| 4 | 4 | Volkswagen Golf | 250 | 288 | 15,2% | 3,5% | 3,5% |
| 5 | 35 | Volvo XC60 | 55 | 276 | 401,8% | 0,8% | 3,3% |
| 6 | 36 | Land Rover Range Rover Evoque | 52 | 252 | 384,6% | 0,7% | 3,0% |
| 7 | 6 | Kia Sportage | 233 | 247 | 6,0% | 3,3% | 3,0% |
| 8 | 15 | Honda CR-V | 110 | 239 | 117,3% | 1,5% | 2,9% |
| 9 | 36 | Toyota RAV4 | 52 | 224 | 330,4% | 0,7% | 2,7% |
| 10 | 36 | Land Rover Range Rover | 52 | 218 | 319,2% | 0,7% | 2,6% |


