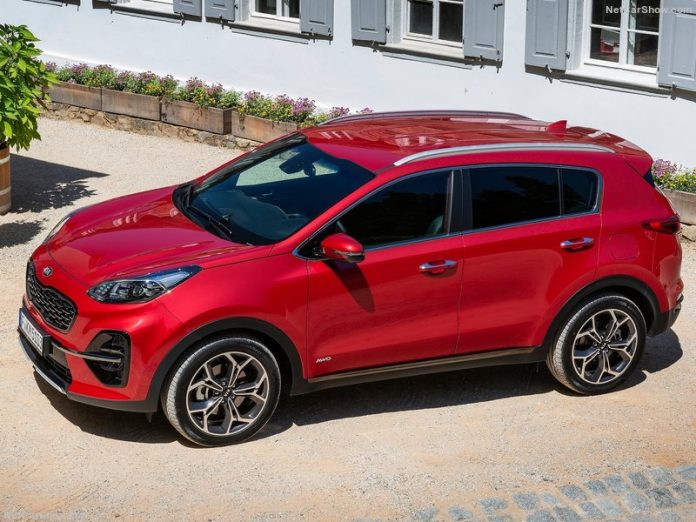
Ecuador new cars sales rebound in the 2018 after the previous two years fall with sales up 66% at 105.080 fueled by the improved economic environment. Chevrolet dominates with 34% of market share while Great Wall ranks 4th, best place worldwide.
Ecuador’s economy grew 3 percent in 2017, showing a strong recovery from the previous year, helped by household consumption, government spending and exports, despite oil sector production was down 2.8 percent, due to OPEC cuts. Ecuador produced 193.9 million barrels in the year, down 3.4 percent from the previous year. The country suffered from the drop in oil prices, a major earthquake and bad economic management over the last decade, according to President Lenin Moreno. The non-oil sector registered growth of 3.5 percent during 2017, due to the recovery of electricity, water, financial services and some other economic sectors.
Ecuadorian vehicles market was severely hit in the 2015/2016 by the economic crisis, generated by the decline of the oil price in the international market, reporting a deep lost of to 62.791 units, the lowest level in a decade, in the 2016. In the 2017, the economic recovery supported a strong recovery in new vehicles demand with figures up 66.3% at 105.080 units, according to data released by the AEADE, the local association of car manufacturers.
| Sales 2012 | Sales 2013 | Sales 2014 | Sales 2015 | Sales 2016 | Sales 2017 | Sales 2018 e | |
|---|---|---|---|---|---|---|---|
| Car+LCV | 119.951 | 112.460 | 118.756 | 80.069 | 62.791 | 104.112 | 94.469 |
| HCV | 1.496 | 1.355 | 1.308 | 1.243 | 383 | 968 | 908 |
| Total | 121.447 | 113.815 | 120.064 | 81.312 | 63.174 | 105.080 | 95.377 |
| 2012 Var | 2013 Var | 2014 Var | 2015 Var | 2016 Var | 2017 Var | 2018 var e | |
|---|---|---|---|---|---|---|---|
| Car+LCV | -13,6% | -6,2% | 5,6% | -32,6% | -21,6% | 65,8% | -9,3% |
| HCV | 32,3% | -9,4% | -3,5% | -5,0% | -69,2% | 152,7% | -6,2% |
| Total | -13,2% | -6,3% | 5,5% | -32,3% | -22,3% | 66,3% | -9,2% |
Brand wise, Chevrolet kept the domination selling 36.627 vehicles (+46.8%) with market share at 34.9%.
In second place Kia with 17.641 units (+153.6%) followed by Hyundai with 8.985 (+93.5%), Great Wall with 6.725 (+141.9%), Suzuki with 5.183 (+48.0%) and others over 80 distributors.
| Rank 2017 | Rank 2016 | Brand | Sales 2017 | Sales 2016 | Variation 2017 | Share 2017 | Share 2016 |
|---|---|---|---|---|---|---|---|
| 1 | 1 | Chevrolet | 36.627 | 24.950 | 46,8% | 34,9% | 39,7% |
| 2 | 2 | Kia | 17.641 | 6.957 | 153,6% | 16,8% | 11,1% |
| 3 | 3 | Hyundai | 8.985 | 4.644 | 93,5% | 8,6% | 7,4% |
| 4 | 6 | Great Wall | 6.725 | 2.780 | 141,9% | 6,4% | 4,4% |
| 5 | 4 | Suzuki | 5.183 | 3.502 | 48,0% | 4,9% | 5,6% |
| 6 | 5 | Toyota | 4.946 | 3.052 | 62,1% | 4,7% | 4,9% |
| 7 | 7 | Nissan | 3.680 | 2.545 | 44,6% | 3,5% | 4,0% |
| 8 | 9 | Hino | 3.342 | 2.079 | 60,7% | 3,2% | 3,3% |
| 9 | 11 | Ford | 2.561 | 1.627 | 57,4% | 2,4% | 2,6% |
| 10 | 8 | Mazda | 1.973 | 2.342 | -15,8% | 1,9% | 3,7% |
| 11 | 10 | Renault | 1.972 | 1.726 | 14,3% | 1,9% | 2,7% |
| 12 | 12 | Volkswagen | 1.759 | 908 | 93,7% | 1,7% | 1,4% |
| 13 | 13 | Chery | 1.565 | 867 | 80,5% | 1,5% | 1,4% |
| 14 | 16 | JAC | 829 | 309 | 168,3% | 0,8% | 0,5% |
| 15 | 14 | Mitsubishi | 664 | 431 | 54,1% | 0,6% | 0,7% |
| 16 | 18 | Citroen | 647 | 203 | 218,7% | 0,6% | 0,3% |
| 17 | 15 | Zotye | 533 | 312 | 70,8% | 0,5% | 0,5% |
| 18 | 29 | Peugeot | 531 | 104 | 410,6% | 0,5% | 0,2% |
| 19 | 24 | FAW | 373 | 165 | 126,1% | 0,4% | 0,3% |
| 20 | 20 | Mercedes | 364 | 195 | 86,7% | 0,3% | 0,3% |
| 21 | 21 | BYD | 316 | 173 | 82,7% | 0,3% | 0,3% |
| 22 | 42 | Fiat | 315 | 48 | 556,3% | 0,3% | 0,1% |
| 23 | 19 | Jeep | 307 | 202 | 52,0% | 0,3% | 0,3% |
| 24 | 23 | Dongfeng | 279 | 166 | 68,1% | 0,3% | 0,3% |
| 25 | 26 | Foton | 264 | 121 | 118,2% | 0,3% | 0,2% |
| 26 | 38 | Changan | 224 | 60 | 273,3% | 0,2% | 0,1% |
| 27 | 17 | Honda | 189 | 227 | -16,7% | 0,2% | 0,4% |
| 28 | 41 | Lifan | 186 | 49 | 279,6% | 0,2% | 0,1% |
| 29 | 27 | BMW | 183 | 113 | 61,9% | 0,2% | 0,2% |
| 30 | 25 | Audi | 166 | 164 | 1,2% | 0,2% | 0,3% |
| 31 | 22 | Changhe | 126 | 168 | -25,0% | 0,1% | 0,3% |
| 32 | 35 | Mitsubishi Fuso | 124 | 74 | 67,6% | 0,1% | 0,1% |
| 33 | 39 | Skoda | 108 | 58 | 86,2% | 0,1% | 0,1% |
| 34 | 28 | Soueast | 101 | 108 | -6,5% | 0,1% | 0,2% |
| 35 | 36 | Beiben | 93 | 72 | 29,2% | 0,1% | 0,1% |
| 35 | 30 | Land Rover | 93 | 96 | -3,1% | 0,1% | 0,2% |
| 36 | 32 | King Long | 85 | 85 | |||
| 37 | 45 | Kenworth | 76 | 19 | |||
| 38 | 34 | International | 75 | 80 | |||
| 39 | 44 | Porsche | 72 | 24 | |||
| 40 | 37 | Golden Dragon | 69 | 69 | |||
| 41 | 44 | Tata | 60 | 24 | |||
| 41 | 44 | Mack | 60 | 24 | |||
| 41 | 43 | Jinbei | 60 | 46 | |||
| 42 | 40 | JMC | 56 | 53 | |||
| 43 | 31 | Scania | 35 | 91 | |||
| 44 | 28 | Mini | 24 | 108 | |||
| 44 | 33 | Yutong | 24 | 84 | |||
| 44 | 42 | Mahindra | 24 | 48 | |||
| 44 | 42 | Qmc | 24 | 48 | |||
| 44 | 44 | Freightliner | 24 | 24 | |||
| 45 | 47 | Iveco | 21 | 12 | |||
| 46 | 47 | UD Trucks | 12 | 12 | |||
| 46 | 47 | Dodge | 12 | 12 | |||
| 46 | 36 | Volvo | 12 | 72 |


