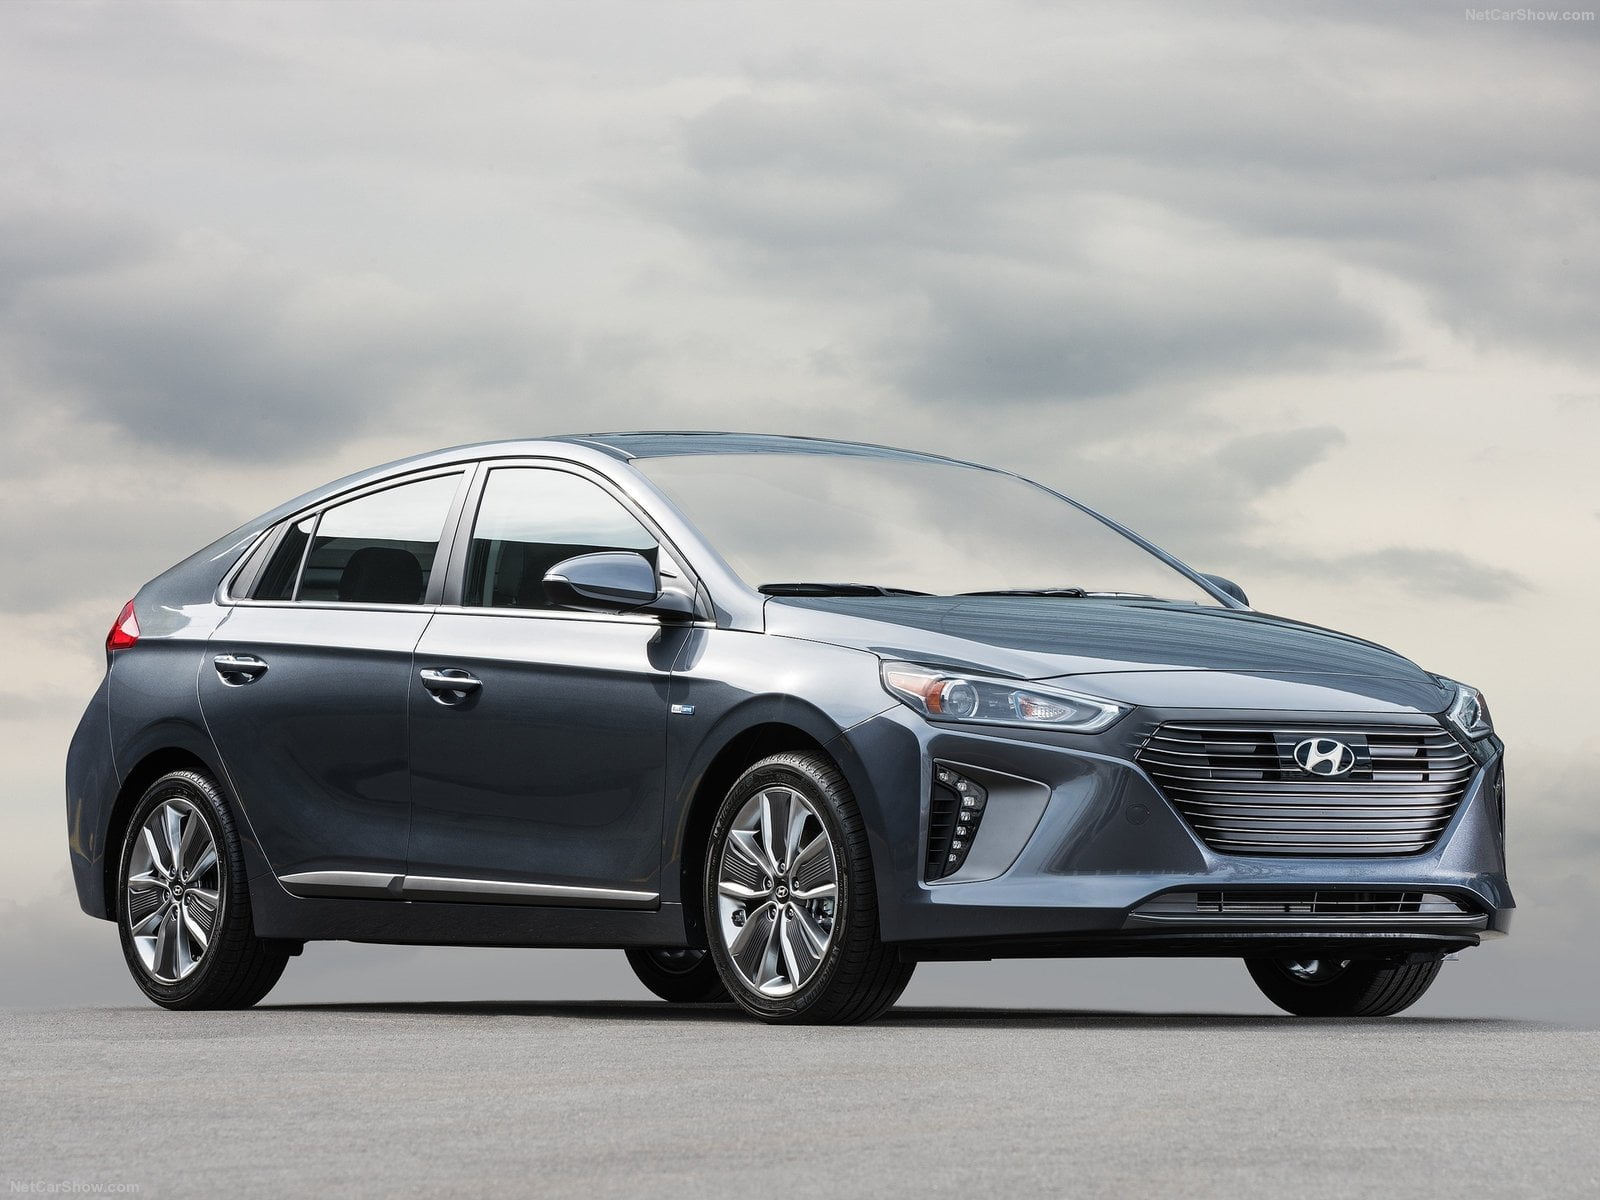
Ecuador Vehicle Market in 2015 tumbled down hit by economic crisis. The automotive industry was reported down 28%, at the lowest since 2005. Chevrolet kept the leadership taking the gap over Kia and Hyundai.
Economic Outlook
As global oil producers struggle with falling export revenues, the pressure is mounting to curb production and restore prices. A loosely-backed plan in February, initiated by Russia and Venezuela, was called into question after it became apparent that the agendas of oil-producing countries could not be aligned.
Further attempts, however, may be in the works and Ecuador is now working with other Latin American producers to establish a unified bargaining position for the upcoming OPEC/Non-OPEC meeting to be held in Russia at the end of March. Meanwhile, the country continues to suffer from a cash crunch.
Public external debt makes up approximately three quarters of total external debt and increased from 12.8% of GDP in January 2014 to 20.4% at the end of 2015. Creditors have taken notice of this striking increase and, given Ecuador’s spotty bond repayment history, they are cautious about lending to the embattled state.
Market Outlook
The collapse of crude prices were only one of the reasons behind the economic recession in Ecuador. The lack of consumer’s demand hit the automotive industry and the market fell down sharply and above any expectations, touching the lowest level since 2005.
Indeed, according to data released by the AEADE, the Association of Ecuador Automotive Industry, the new light passengers vehicles sold in the second half 2015 had been 35.024 with a total of 81.309 units in the year, down 28.6% compared to the previous year.
Chevrolet was on top of the list with 40.265 sales against 53.574 in 2014 (-24.5%), followed by Kia with 7.648 (-36.5%), Hyundai with 5.678 (-46.6%), Nissan with 3.794 (-37.0%) and Toyota and Mazda with 3.651, down respectively 43.6% and 47.2%.
Below, you can sort our interactive tables to see data regarding Brands, Groups and Models. Please bear in mind that sales data are subject to adjustments as sources will update their information. This report is updated at the publishing date and will not be modified while the next on this subject will always have the year to date data updated.
| Rank Jun | Rank 2015 | Brand | Jun 2015 | H1 2015 | Var Jun | Var H1 | Share Jun | Share H1 |
|---|---|---|---|---|---|---|---|---|
| 1 | 1 | Chevrolet | 2.509 | 15.810 | -18,3% | -23,1% | 41,6% | 39,2% |
| 2 | 2 | Kia | 802 | 5.064 | -20,0% | -15,9% | 13,3% | 12,5% |
| 3 | 3 | Hyundai | 642 | 4.414 | -26,6% | -14,8% | 10,7% | 10,9% |
| 4 | 4 | Mazda | 453 | 2.766 | -21,4% | -20,0% | 7,5% | 6,9% |
| 6 | 5 | Toyota | 358 | 2.606 | -33,7% | -19,6% | 5,9% | 6,5% |
| 5 | 6 | Nissan | 401 | 2.456 | -20,1% | -18,3% | 6,7% | 6,1% |
| 7 | 7 | Ford | 225 | 1.561 | -35,7% | -15,8% | 3,7% | 3,9% |
| 9 | 8 | Renault | 141 | 1.203 | -34,7% | -6,8% | 2,3% | 3,0% |
| 10 | 9 | Volkswagen | 133 | 916 | -17,9% | -5,7% | 2,2% | 2,3% |


