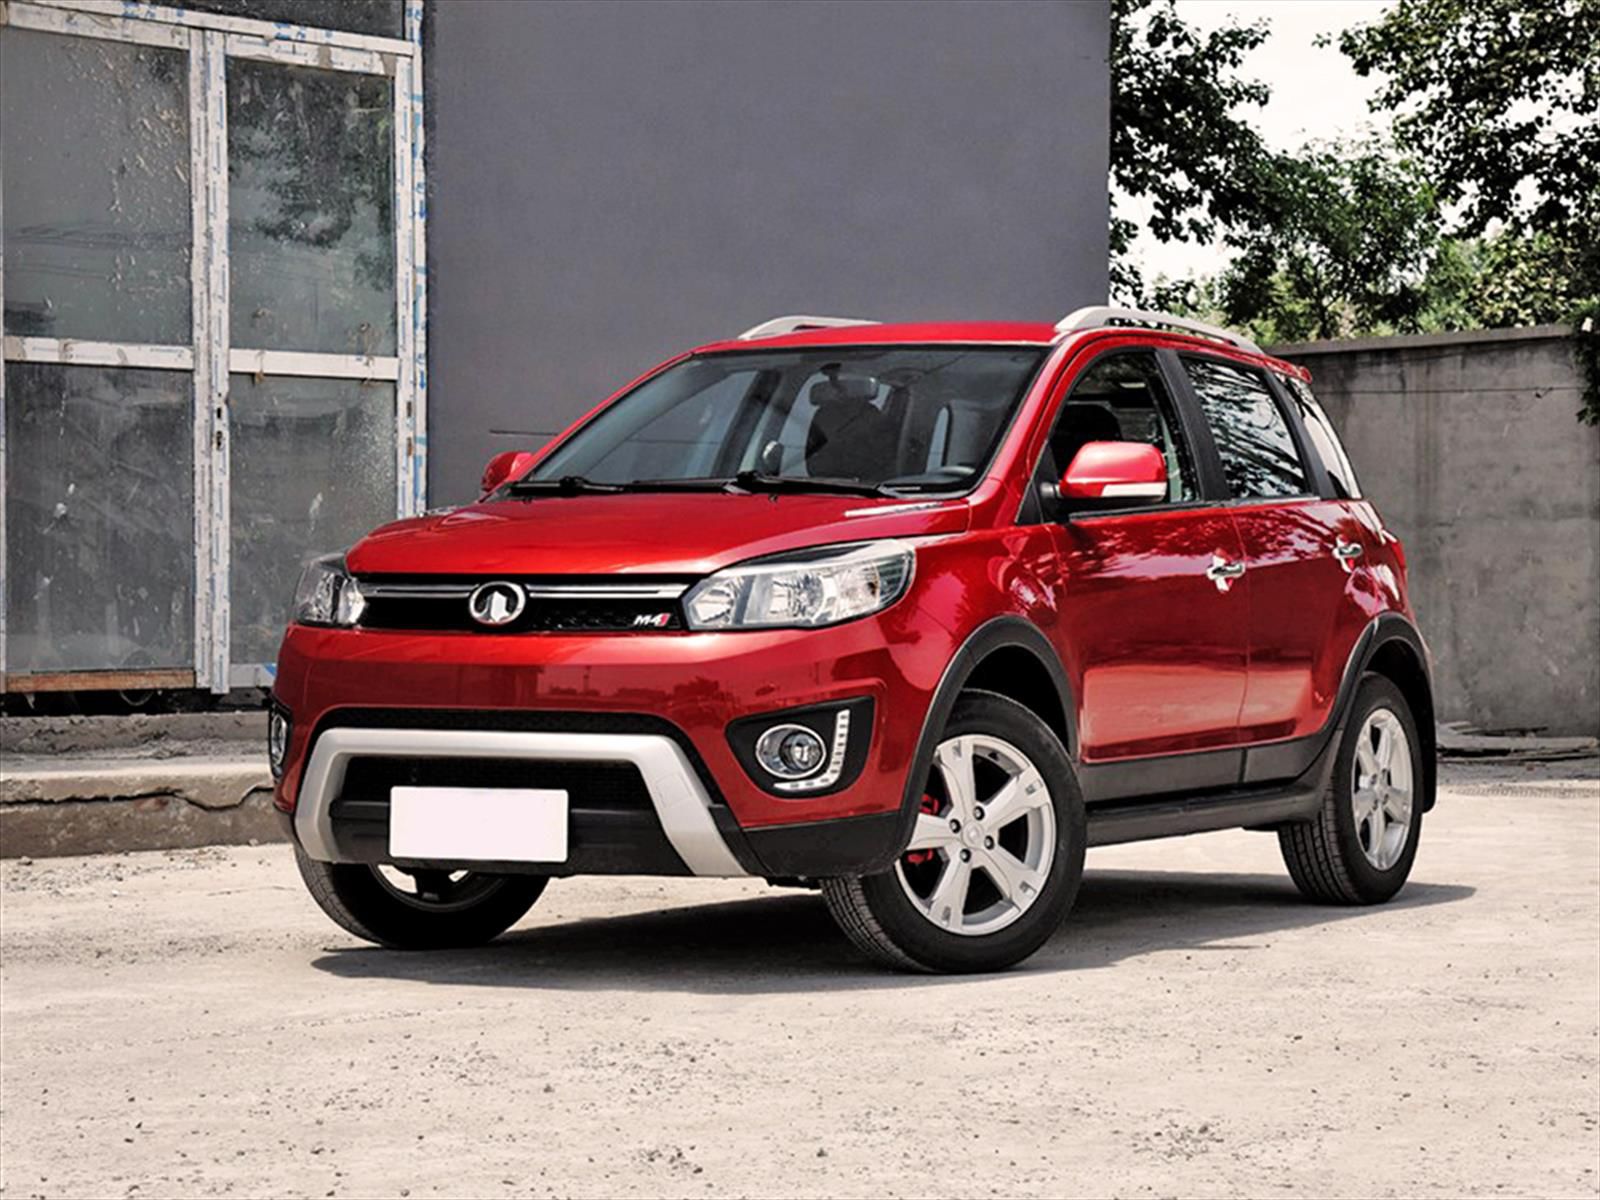
Ecuadorian vehicles market kept the impressive momentum in 2018 with 136.738 sales, up 32.1%. Chevrolet was still on top, holding 35.2% of share, ahead of Kia and Hyundai. The winner of the year was Toyota, soaring to 66.9%.
Economic Environment
Ecuador’s economy likely remained subdued in the final quarter of the 2018 as tighter credit availability weighed on private consumption and investment. Persistently downbeat consumer sentiment has also curbed household spending. While financial assistance from the IMF should help address structural imbalances within the economy and bring the external debt burden onto a more sustainable path, growth is expected to lose more ground this year as spending cuts and tighter credit conditions curb domestic demand.
Market Trend
Ecuadorian vehicles market was severely hit in the 2015/2016 by the economic crisis, generated by the decline of the oil price in the international market, reporting a deep lost of to 62.791 units, the lowest level in a decade, in the 2016. In the 2017, the economic recovery supported a strong recovery in new vehicles demand with figures up 66.3% at 105.080 units, according to data released by the AEADE, the local association of car manufacturers.
In the 2018, sales have kept the momentum improving volumes at a remarkable level. Indeed, the market followed the previous year’s path, ending with sales at 136.737 and surging to 32.1%.
| Sales 2012 | Sales 2013 | Sales 2014 | Sales 2015 | Sales 2016 | Sales 2017 | Sales 2018 | '+/- 2018 | |
|---|---|---|---|---|---|---|---|---|
| Car+LCV | 119.951 | 112.460 | 118.756 | 80.069 | 62.266 | 103.545 | 136.738 | 32,1% |
The competitive landscape in 2018 was dominated by the American brand Chevrolet that led the run with sales at 48.165 (+31.5%) and 35.2% of market share. In second place Kia with 24.771 units (+40.4%) followed by Hyundai with 13.762 (+53.2%), Great Wall with 9.633 (+43.2%), Toyota with 8.257 (+66.9%) and others over 80 distributors.
| Rank 2018 | Rank 2017 | Sales 2018 | Sales 2017 | '+/- 2018 | Share 2018 | |
|---|---|---|---|---|---|---|
| 1 | 1 | Chevrolet | 48.165 | 36.627 | 31,5% | 35,2% |
| 2 | 2 | Kia | 24.771 | 17.641 | 40,4% | 18,1% |
| 3 | 3 | Hyundai | 13.762 | 8.985 | 53,2% | 10,1% |
| 4 | 4 | Great Wall | 9.633 | 6.725 | 43,2% | 7,0% |
| 5 | 6 | Toyota | 8.257 | 4.946 | 66,9% | 6,0% |
| 6 | 7 | Nissan | 5.505 | 3.680 | 49,6% | 4,0% |
| 7 | 9 | Ford | 4.128 | 2.561 | 61,2% | 3,0% |
| 8 | 5 | Suzuki | 3.892 | 5.183 | -24,9% | 2,8% |
| 9 | 10 | Mazda | 2.753 | 1.973 | 39,5% | 2,0% |
| 10 | 13 | Chery | 2.752 | 1.565 | 75,8% | 2,0% |


