Estonia Cars Market in 2016 gained ground in double digit, hitting the best performance since 2009. Land Rover shined while the Skoda Octavia was back in pole position ahead of Toyota Auris and Avensis.
Market Outlook
In 2016 Estonia is expected to have grown at a mild pace, mainly supported by private consumption, which benefited from growing wages and low, albeit increasing, unemployment. After a pickup in growth in the third quarter on the back of a positive contribution of the external sector, the latest monthly data point to a further acceleration in Q4. FocusEconomics panelists currently foresee GDP expanding 2.3% in 2017.
Following the sales slip of the previous year, the domestic cars market in 2016 recovered with a double digit increase. It was the best performance scored since the 2009 huge fall with car passenger’s sales at 22.429 units (+10.2%).
According to data released by the Estonian Road Administration (E.R.A.), the light commercial vehicles had been 3.919 (+9.4%), hitting the sixth consecutive annual growth.
Competitive Arena
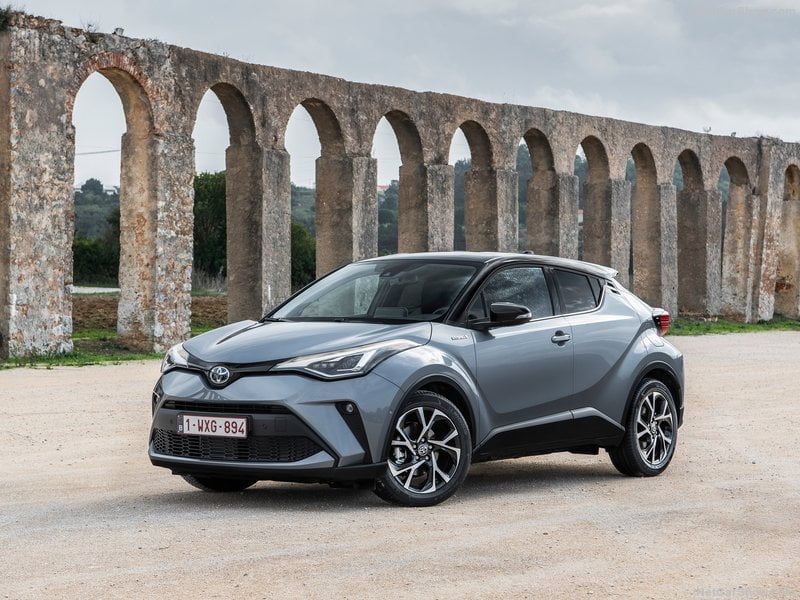
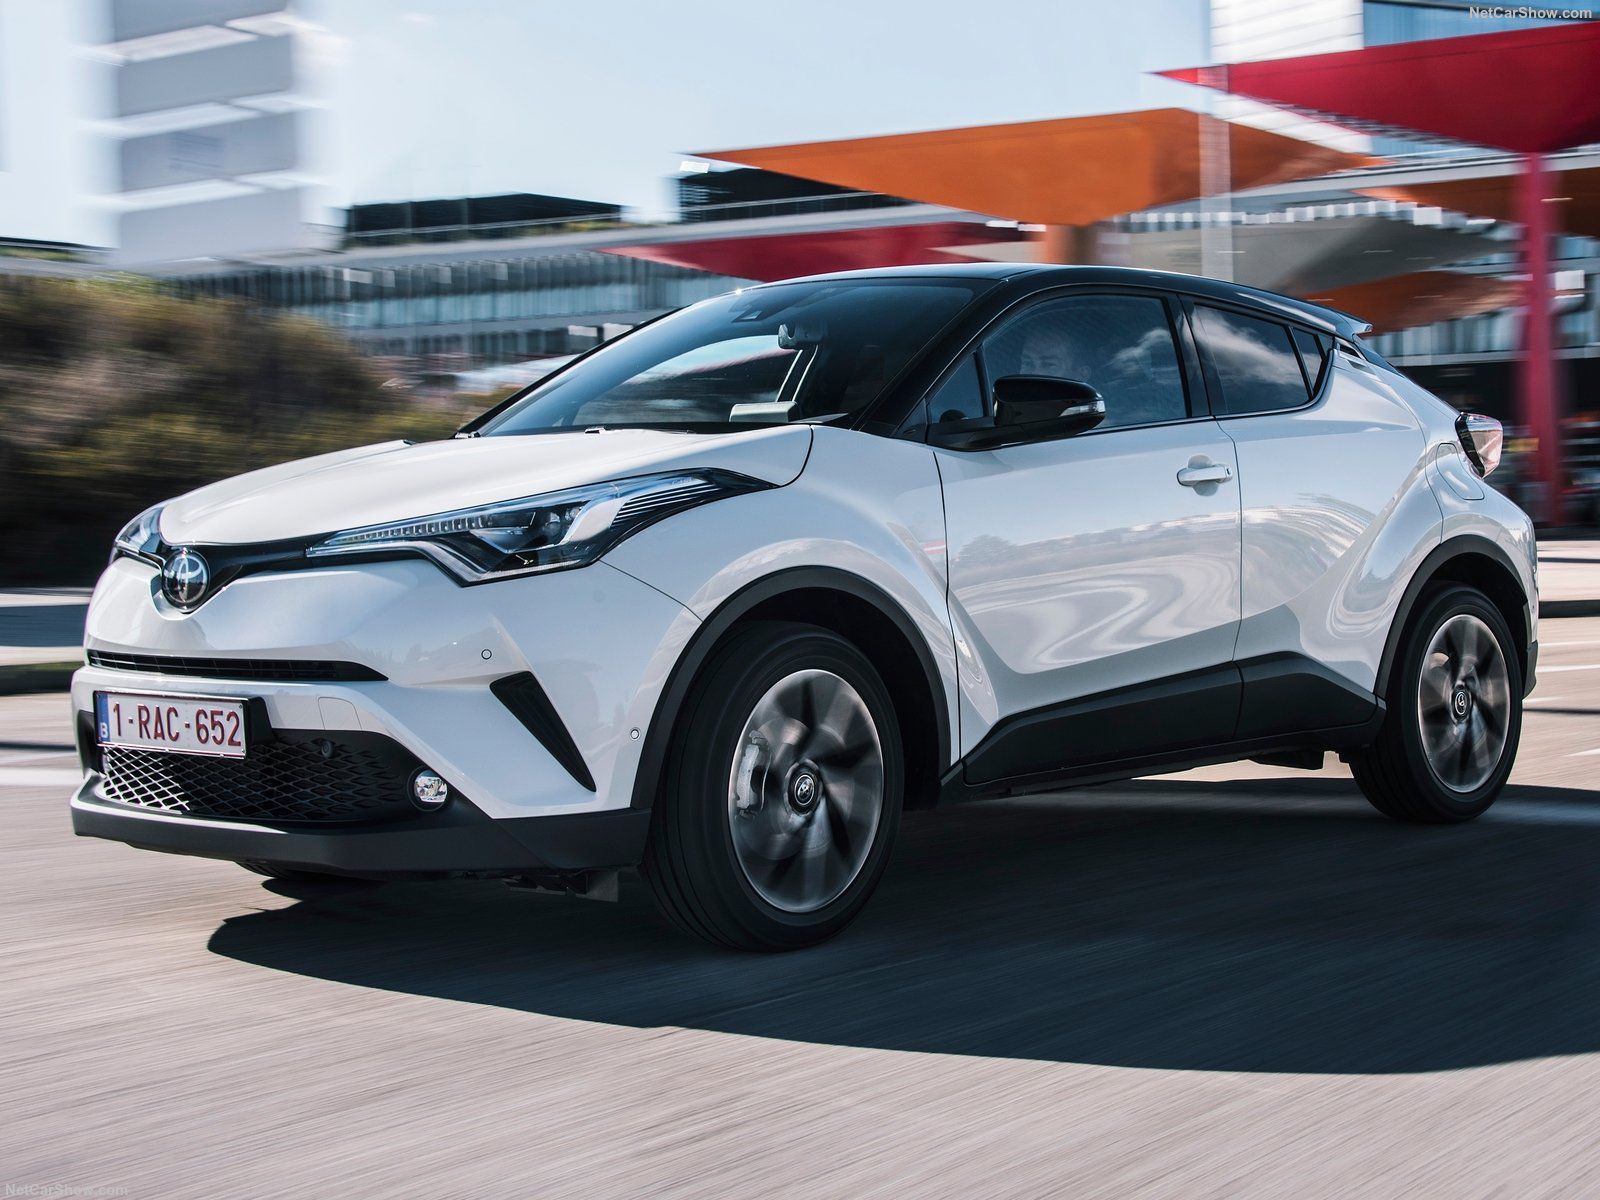
Toyota kept the leadership for the second year in a row with 3.221 units (+17.9%) and 14.0% of market share, ahead of Skoda witn 2.484 (+19.8%) and Renault with 1.966 (+12.5%). Land Rover was the best performer of 2016 gaining 94.9%, while among the highest increase in double digit were reported by Mazda, Audi, Kia, Subaru and Peugeot.
Nissan lost 33.7%, hitting the worst performance of the year, followed by Hyundai and Suzuki.
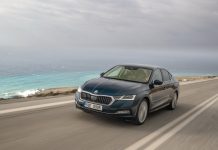
The Skoda Octavia was the best selling model for the third year, after reaching the pole position in 2011 and 2014, up 27.7% at 1.139 sales. Toyota managed the remaining steps of the podium with Avensis and Auris, respectively up 11.3% and 14.1% at 838 units and 762.
See all details in the tables below.
Below, you can sort our interactive tables to see data regarding Brands, Groups and Models. Please bear in mind that sales data are subject to adjustments as sources will update their information. This report is updated at the publishing date and will not be modified while the next on this subject will always have the year to date data updated.
| Rank 2016 | Rank 2015 | BRAND | Sales 2016 | Sales 2015 | Variation 2016 | Share 2016 | Share 2015 |
|---|---|---|---|---|---|---|---|
| 1 | 1 | Toyota | 3.221 | 2.731 | 17,9% | 14,0% | 13,0% |
| 2 | 2 | Skoda | 2.484 | 2.073 | 19,8% | 10,8% | 9,9% |
| 3 | 3 | Renault | 1.966 | 1.747 | 12,5% | 8,6% | 8,3% |
| 4 | 5 | Volkswagen | 1.895 | 1.691 | 12,1% | 8,3% | 8,1% |
| 5 | 6 | Honda | 1.541 | 1.485 | 3,8% | 6,7% | 7,1% |
| 6 | 7 | Kia | 1.224 | 1.058 | 15,7% | 5,3% | 5,0% |
| 7 | 4 | Nissan | 1.125 | 1.698 | -33,7% | 4,9% | 8,1% |
| 8 | 8 | Subaru | 1.030 | 892 | 15,5% | 4,5% | 4,2% |
| 9 | 10 | Peugeot | 955 | 840 | 13,7% | 4,2% | 4,0% |
| 10 | 9 | Dacia | 932 | 847 | 10,0% | 4,1% | 4,0% |
| 11 | 11 | Opel | 882 | 828 | 6,5% | 3,8% | 3,9% |
| 12 | 13 | Citroen | 662 | 606 | 9,2% | 2,9% | 2,9% |
| 13 | 14 | Ford | 586 | 602 | -2,7% | 2,6% | 2,9% |
| 14 | 12 | Hyundai | 501 | 722 | -30,6% | 2,2% | 3,4% |
| 15 | 15 | Audi | 488 | 404 | 20,8% | 2,1% | 1,9% |
| 16 | 17 | Mazda | 444 | 315 | 41,0% | 1,9% | 1,5% |
| 17 | 20 | Mercedes | 383 | 280 | 36,8% | 1,7% | 1,3% |
| 18 | 21 | Land Rover | 380 | 195 | 94,9% | 1,7% | 0,9% |
| 19 | 16 | BMW | 370 | 330 | 12,1% | 1,6% | 1,6% |
| 20 | 19 | Volvo | 350 | 281 | 24,6% | 1,5% | 1,3% |
| 21 | 23 | Mitsubishi | 233 | 176 | 32,4% | 1,0% | 0,8% |
| 22 | 18 | Suzuki | 214 | 283 | -24,4% | 0,9% | 1,3% |
| 23 | 25 | Lexus | 192 | 142 | 35,2% | 0,8% | 0,7% |
| 24 | 22 | Seat | 151 | 192 | -21,4% | 0,7% | 0,9% |
| 25 | 26 | Jeep | 137 | 132 | 3,8% | 0,6% | 0,6% |
| 26 | 24 | Fiat | 127 | 162 | -21,6% | 0,6% | 0,8% |
| 27 | 27 | Porsche | 109 | 79 | 38,0% | 0,5% | 0,4% |
| 28 | 30 | DS | 90 | 30 | 200,0% | 0,4% | 0,1% |
| 29 | 31 | Alfa Romeo | 82 | 29 | 182,8% | 0,4% | 0,1% |
| 30 | 28 | Mini | 68 | 60 | 13,3% | 0,3% | 0,3% |
| 31 | 29 | SsangYong | 53 | 32 | 65,6% | 0,2% | 0,2% |
| 32 | 34 | Jaguar | 24 | 10 | 140,0% | 0,1% | 0,0% |
| 33 | 32 | Cadillac | 16 | 18 | -11,1% | 0,1% | 0,1% |
| 34 | 36 | Maserati | 12 | 3 | 300,0% | 0,1% | 0,0% |
| 35 | 35 | Tesla | 11 | 6 | 83,3% | 0,0% | 0,0% |
| 36 | 38 | Bentley | 7 | 1 | 600,0% | 0,0% | 0,0% |
| 37 | 36 | Dodge | 4 | 3 | 33,3% | 0,0% | 0,0% |
| 37 | 33 | Lancia | 4 | 13 | -69,2% | 0,0% | 0,1% |
| 38 | 37 | Lamborghini | 3 | 2 | 50,0% | 0,0% | 0,0% |
| 39 | 38 | Ferrari | 2 | 1 | 100,0% | 0,0% | 0,0% |
| 40 | 38 | Lotus | 1 | 1 | 0,0% | 0,0% | 0,0% |
| 40 | 39 | Aston Martin | 1 | - | 0,0% | 0,0% | |
| 40 | 37 | Chevrolet | 1 | 2 | -50,0% | 0,0% | 0,0% |
| 40 | 39 | Rolls-Royce | 1 | - | 0,0% | 0,0% | |
| 40 | 39 | GMC | 1 | - | 0,0% | 0,0% |
| Rank 2016 | Rank 2015 | Group | Sales 2015 | Sales 2016 | Variation 2016 | Share 2016 | Share 2015 |
|---|---|---|---|---|---|---|---|
| 1 | 1 | Volkswagen | 4.442 | 5.137 | 15,6% | 22,4% | 21,2% |
| 2 | 2 | Renault-Nissan | 4.292 | 4.023 | -6,3% | 17,5% | 20,4% |
| 3 | 3 | Toyota | 2.873 | 3.413 | 18,8% | 14,9% | 13,7% |
| 4 | 4 | Hyundai-Kia | 1.780 | 1.725 | -3,1% | 7,5% | 8,5% |
| 5 | 6 | PSA | 1.476 | 1.707 | 15,7% | 7,4% | 7,0% |
| 6 | 5 | Honda | 1.485 | 1.541 | 3,8% | 6,7% | 7,1% |
| 7 | 7 | Fuji Heavy Industries | 892 | 1.030 | 15,5% | 4,5% | 4,2% |
| 8 | 8 | General Motors | 848 | 900 | 6,1% | 3,9% | 4,0% |
| 9 | 9 | Ford | 602 | 586 | -2,7% | 2,6% | 2,9% |
| 10 | 12 | Mazda | 315 | 444 | 41,0% | 1,9% | 1,5% |
| Rank 2016 | Rank 2015 | Model | Sales 2016 | Sales 2015 | 2016 Variation |
|---|---|---|---|---|---|
| 1 | 2 | Skoda Octavia | 1.139 | 892 | 27,7% |
| 2 | 3 | Toyota Avensis | 838 | 753 | 11,3% |
| 3 | 5 | Toyota Auris | 762 | 668 | 14,1% |
| 4 | 1 | Nissan Qashqai | 738 | 1.001 | -26,3% |
| 5 | 6 | Dacia Duster | 725 | 628 | 15,4% |
| 6 | 4 | Honda CR-V | 694 | 750 | -7,5% |
| 7 | 8 | Volkswagen Passat | 675 | 555 | 21,6% |
| 8 | 12 | Toyota RAV4 | 594 | 442 | 34,4% |
| 9 | 9 | Subaru Legacy | 565 | 500 | 13,0% |
| 10 | 17 | Kia Sportage | 543 | 366 | 48,4% |
| 11 | 7 | Skoda Fabia | 523 | 582 | -10,1% |
| 12 | 29 | Skoda Superb | 508 | 184 | 176,2% |
| 13 | 14 | Toyota Corolla sedan | 501 | 421 | 19,0% |
| 14 | 11 | Renault Mégane | 463 | 463 | 0,0% |
| 15 | 15 | Volkswagen Golf | 459 | 397 | 15,6% |
| 16 | 16 | Renault Captur | 410 | 371 | 10,5% |
| 17 | 10 | Honda Civic | 388 | 488 | -20,5% |
| 18 | 21 | Renault Clio | 374 | 247 | 51,4% |
| 19 | 64 | Honda HR-V | 365 | 69 | 429,0% |
| 20 | 18 | Kia Ceed | 335 | 365 | -8,2% |
| 21 | 19 | Subaru Forester | 309 | 307 | 0,7% |
| 22 | 13 | Renault Scénic | 262 | 438 | -40,2% |
| 23 | 35 | Opel Astra | 261 | 157 | 66,2% |
| 24 | 23 | Opel Mokka | 247 | 233 | 6,0% |
| 25 | 25 | Volkswagen Tiguan | 243 | 207 | 17,4% |
| 26 | 22 | Skoda Rapid | 228 | 241 | -5,4% |
| 27 | 46 | Audi Q5 | 224 | 111 | 101,1% |
| 28 | 26 | Toyota Yaris | 222 | 199 | 11,6% |
| 29 | 40 | Peugeot 2008 | 218 | 129 | 69,1% |
| 30 | 51 | Citroen C4 | 213 | 94 | 126,7% |
| 31 | 20 | Ford Focus | 206 | 267 | -22,8% |
| 32 | 28 | Peugeot 308 | 195 | 184 | 6,0% |
| 33 | 55 | Renault Kadjar | 186 | 83 | 124,1% |
| 34 | 41 | Peugeot 208 | 180 | 126 | 42,9% |
| 35 | 55 | Hyundai Tucson | 171 | 83 | 106,0% |
| 36 | 62 | Land Rover Range Rover Sport | 170 | 71 | 139,6% |
| 36 | 34 | Opel Corsa | 170 | 158 | 7,6% |
| 37 | 80 | Mazda CX-3 | 169 | 43 | 293,0% |
| 38 | 48 | Mitsubishi Outlander | 168 | 106 | 58,7% |
| 39 | 33 | Hyundai i20 | 162 | 164 | -1,2% |
| 40 | 37 | Toyota Land Cruiser | 155 | 140 | 10,7% |


