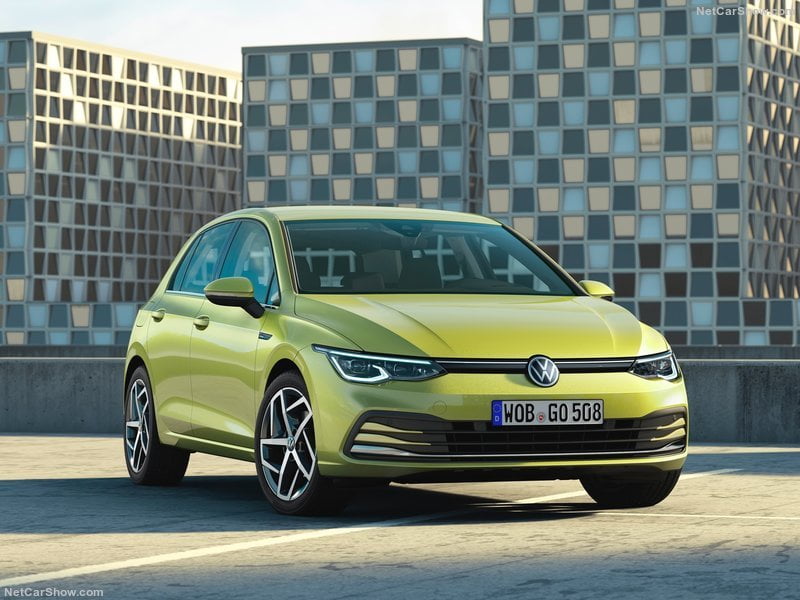
Europe best selling cars ranking in 2019 within 44 markets in the continent, from Portugal to Russia. The Volkswagen Golf was on top, despite losing terrain, but still holding a large gap over the Polo. The Dacia Duster managed to enter the Top 10, up 6 spots from last year.
Economic Environment
Eurozone economy kept pace in the third quarter, although growth was modest. The expansion was underpinned by healthy consumer spending, but restrained by cooling investment activity and an unsupportive external backdrop. Data suggests subdued momentum carried over into the final quarter of 2019. A sharper drop in industrial production in October, weak PMI readings in November-December and downbeat business sentiment in the first two months of Q4 point to protracted weakness, while feebler retail sales and consumer confidence indicate softening consumer spending.
Momentum is set to remain feeble next year. Soft global growth and an uncertain external backdrop will dent exports and investment activity; smaller job gains, due to rigid labor markets in key countries, will restrain consumer spending; while political uncertainty in Italy and Spain, coupled with Brexit negotiations and a possible resurgence in global trade tensions, cloud the outlook.
Best Selling Cars
As far as the best selling cars ranking within the entire continents (44 markets from Portugal to those in the East, like Russia, Ukraine, Turkey, Moldova) is currently dominated – for the 44th year in a string – by the Volkswagen Golf.
The ranking in 2019 reported the current decade’s undisputed leader, the Volkswagen Golf, still dominating – despite losing terrain – with 458.594 units sold.
In second place the Volkswagen Polo with 330.921 units sold (-12.8%). With more than 14 million units sold, it is one of the world’s most successful compact cars ever and actually the best seller. The sixth generation was launched in late 2017, with new exterior design, noticeably more spacious interior that has also been redesigned down to the last detail, new cockpit layout structured for the digital world, efficient TSI (petrol), TGI (natural gas) and TDI (diesel) engines as well as an array of assistance systems which previously was only familiar in larger Volkswagen cars.
The Renault Clio kept the third position with 302.993 units sold (-17.4%). Launched in the 1990, actually is in the fourth generation, launched in 2012.
The Volkswagen Tiguan held the fourth position with 297.224 sales (+0.8%) followed by the Skoda Octavia, which gained 2 positions despite reporting a flat trend, and the Nissan Qashqai.
Impressive performance scored by the Dacia Duster – up 6 spots from last year – surging to 19.7% and managing to enter the Top 10.
Service Solutions
Since 2010, focus2move.com is a specialist in the automotive industry tracking monthly sales for all brands and models in the widest in the World range of countries, actually over 150. From this huge database we can extract data sorted under your own conditions and deliver historical data in excel.
If you like to receive historical data or to subscribe at monthly update, contact us at kventura@focus2move.com and we will arrange a short video call. By showing you our database and segmentation, we can find together the best solutions for your team.
| Rank 2019 | Rank 2018 | Model | Sales 2019 | 2019 Var | December Sales | December var |
|---|---|---|---|---|---|---|
| 1 | 1 | Volkswagen Golf | 458.595 | -9,0% | 31.436 | -0,9% |
| 2 | 2 | Volkswagen Polo | 330.922 | -12,8% | 24.200 | -18,7% |
| 3 | 3 | Renault Clio | 302.994 | -17,4% | 20.995 | -31,2% |
| 4 | 4 | Volkswagen Tiguan | 297.224 | 0,8% | 24.114 | 17,2% |
| 5 | 7 | Skoda Octavia | 268.954 | 0,5% | 21.566 | 16,4% |
| 6 | 5 | Nissan Qashqai | 260.428 | -6,2% | 25.382 | 33,6% |
| 7 | 10 | Ford Focus | 243.825 | 8,0% | 17.765 | 1,8% |
| 8 | 11 | Dacia Sandero | 233.460 | 4,5% | 20.061 | 13,7% |
| 9 | 6 | Ford Fiesta | 233.019 | -15,5% | 14.185 | -15,7% |
| 10 | 16 | Dacia Duster | 231.906 | 19,7% | 22.845 | 50,0% |
| 11 | 9 | Citroen C3 | 230.907 | -0,4% | 15.053 | -8,0% |
| 12 | 8 | Peugeot 208 | 230.843 | -2,5% | 18.184 | 13,3% |
| 13 | 12 | Opel Corsa | 227.390 | 2,3% | 8.716 | -39,1% |
| 14 | 13 | Renault Captur | 223.367 | 1,3% | 18.557 | 15,3% |
| 15 | 14 | Toyota Yaris | 213.420 | -2,2% | 15.162 | 4,7% |
| 16 | 15 | Peugeot 3008 | 210.066 | -2,2% | 18.925 | 29,1% |
| 17 | 33 | volkswagen T-Roc | 200.583 | 45,0% | 13.443 | 28,0% |
| 18 | 29 | Mercedes A Class | 197.599 | 26,1% | 16.699 | -1,6% |
| 19 | 24 | Fiat Panda | 186.763 | 8,9% | 14.754 | 9,6% |
| 20 | 18 | Ford Kuga | 178.226 | -3,1% | 24.797 | 119,9% |
| 21 | 22 | Hyundai Tucson | 172.703 | -0,4% | 15.726 | 26,8% |
| 22 | 19 | Skoda Fabia | 166.831 | -7,0% | 10.360 | -6,1% |
| 23 | 26 | Mercedes C Class | 166.017 | 1,0% | 10.734 | -15,0% |
| 24 | 20 | Peugeot 2008 | 165.604 | -7,0% | 11.553 | -2,2% |
| 25 | 25 | Fiat 500 | 160.699 | -4,8% | 11.106 | 12,4% |
| 26 | 23 | Renault Mégane | 158.601 | -8,5% | 14.258 | 8,2% |
| 27 | 27 | Kia Sportage | 156.751 | -4,0% | 13.756 | 19,4% |
| 28 | 17 | Volkswagen Passat | 149.096 | -20,7% | 16.930 | 24,8% |
| 29 | 21 | Opel Astra | 148.098 | -16,5% | 8.151 | -27,4% |
| 30 | 28 | Peugeot 308 | 144.710 | -7,9% | 9.757 | -4,6% |
| 31 | 131 | Toyota Corolla | 144.446 | 213,5% | 13.185 | 203,0% |
| 32 | 31 | Seat Leon | 141.227 | -4,8% | 10.284 | 18,4% |
| 33 | 50 | Lada Granta | 139.068 | 28,3% | 14.795 | 43,9% |
| 34 | 30 | Kia Rio | 135.706 | -10,3% | 10.148 | -10,3% |
| 35 | 32 | Audi A3 | 129.022 | -12,0% | 8.706 | -18,2% |
| 36 | 53 | Toyota RAV4 | 125.883 | 20,6% | 11.457 | 50,3% |
| 37 | 46 | BMW 3 Series | 125.877 | 13,5% | 12.215 | 53,3% |
| 38 | 34 | Toyota C-HR | 125.368 | -8,0% | 8.438 | -9,9% |
| 39 | 35 | Mini | 124.194 | -4,5% | 11.966 | 2,1% |
| 40 | 43 | Ford Ecosport | 122.075 | 5,3% | 8.441 | 5,6% |
| 41 | 45 | Lada Vesta | 120.175 | 4,7% | 11.631 | 10,9% |
| 42 | 36 | Mercedes E Class | 117.311 | -9,6% | 9.485 | 6,5% |
| 43 | 40 | BMW X1 | 117.239 | -0,4% | 11.553 | 9,9% |
| 44 | 42 | Volkswagen Caddy | 113.530 | -2,7% | 8.311 | -7,2% |
| 45 | 73 | Skoda Kodiaq | 112.642 | 37,9% | 12.824 | 68,8% |
| 46 | 63 | Kia Ceed | 112.416 | 21,2% | 8.288 | 45,8% |
| 47 | 49 | Renault Kadjar | 111.396 | 2,5% | 11.153 | 45,7% |
| 48 | 38 | BMW 1 Series | 110.626 | -12,1% | 12.362 | 4,5% |
| 49 | 61 | Opel Crossland X | 110.496 | 17,8% | 8.804 | 30,7% |
| 50 | 37 | Mercedes GLC | 109.582 | -15,2% | 9.091 | 0,9% |


