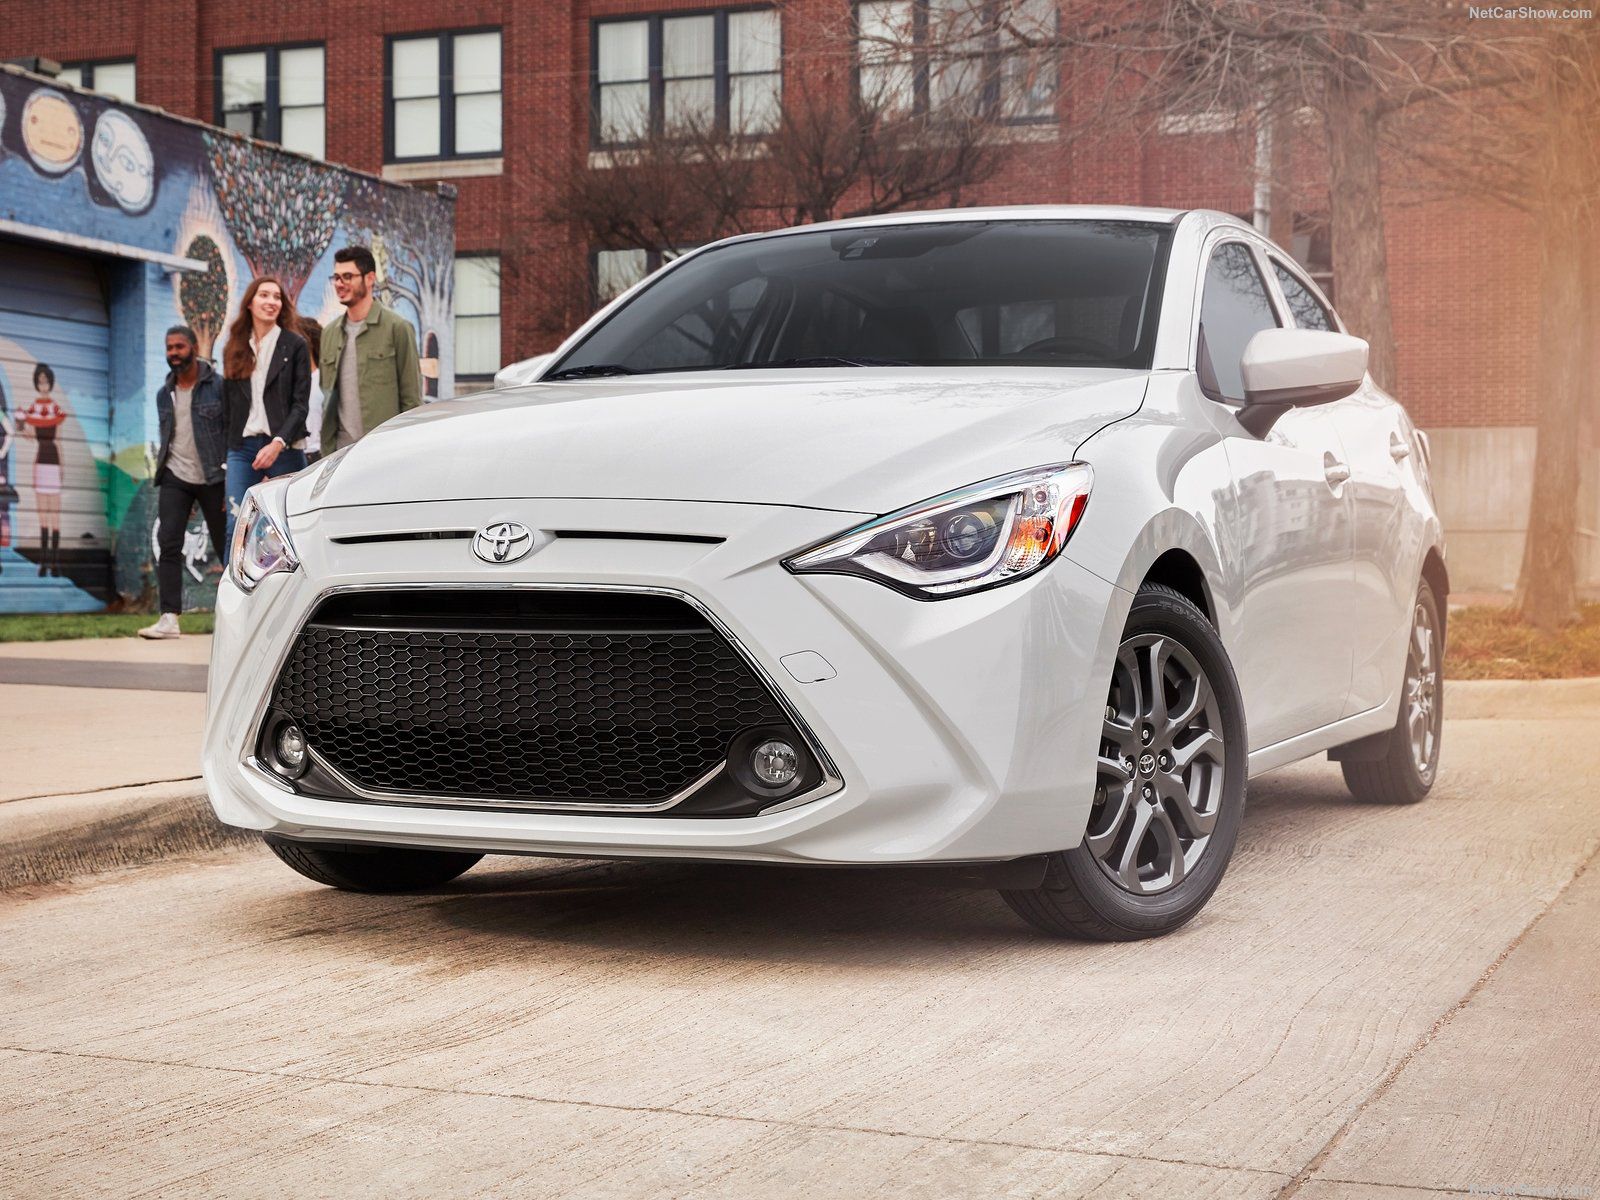
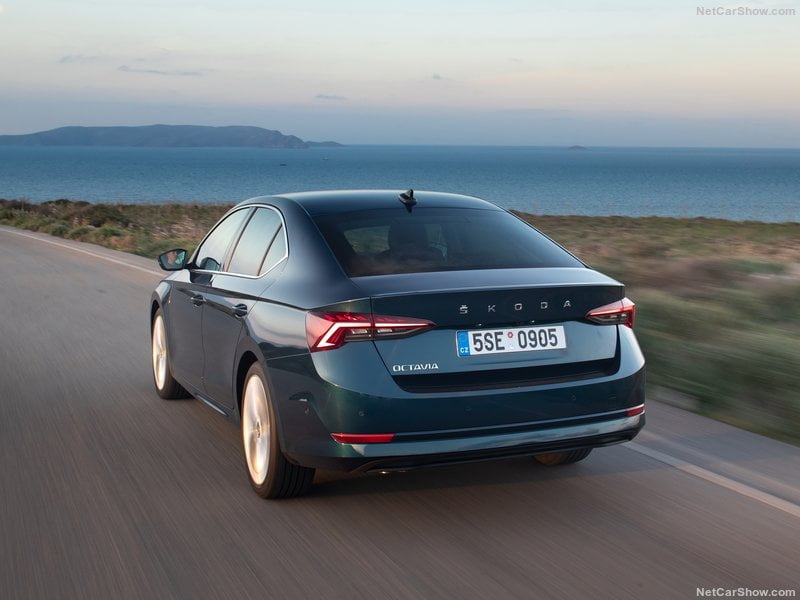
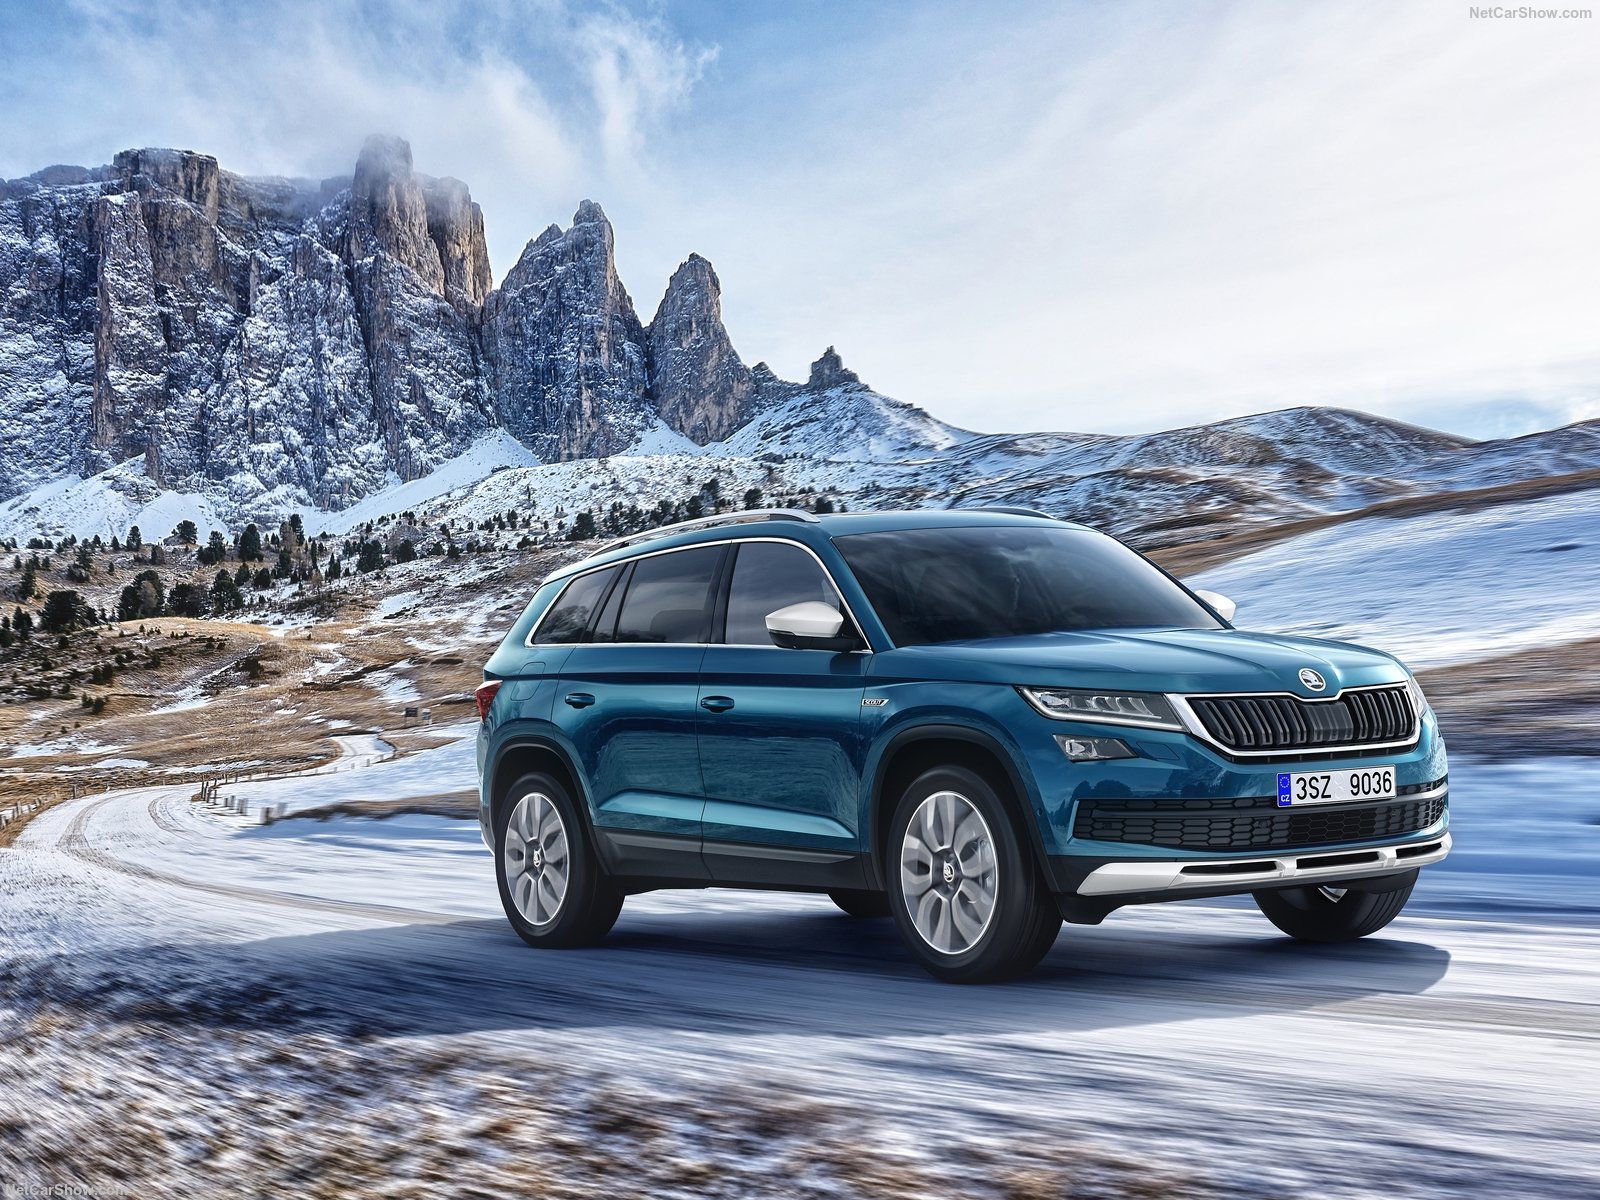
Georgian vehicles market has grown 17.4% in 2018, despite a huge drop in the first quarter, ending the year with sales at 4.073. Toyota, the market leader, was followed by Skoda – up 65.7% – and Hyundai.
Economic Environment
Georgia’s economy growth rebounded strongly in December, following a particularly weak performance in November when election-related uncertainties likely ate into consumption and investment gains. As a result, economic activity growth, on average, accelerated slightly in Q4 compared to Q3. In addition, exports continued to post double-digit growth in Q4, on the back of booming demand for commodities and motor cars, particularly from Azerbaijan, Kazakhstan and Ukraine.
Growth is seen losing pace this year, but should remain solid nonetheless, propped up by robust investment activity amid increased inflows of EU development funds. Meanwhile, medium-term growth should benefit from improved resilience of the financial system due to the implementation of structural reforms.
Market Trend
Georgian vehicles market in recent years have been quite stable with total vehicles sales in the 2017 at 3.506, down 1.3% from the previous year. However, despite all positive news from the economic and political side, the development of new vehicles market is still limited by the import of second hands vehicles from others CIS countries.
In the 2018 the market has improved from the previous year. Indeed, after a very bad start, where first quarter sales were down 55.9%, the market has fully recovered ending the year with registrations at 4.073 (+17.4%).
| Market | Sales 2014 | Sales 2015 | Sales 2016 | Sales 2017 | Sales 2018 | '+/- 2018 |
|---|---|---|---|---|---|---|
| Car+LCV | 3.250 | 3.193 | 3.551 | 3.470 | 4.073 | 17,4% |
The 2018 market leader was Toyota with 1.580 sales (+14.5%), followed by Skoda with 348 sales (+65.7%) and Hyundai with 289 sales (+9.5%).
| Rank 2018 | Rank 2017 | Sales 2018 | Sales 2017 | '+/- 2018 | Share 2018 | |
|---|---|---|---|---|---|---|
| 1 | 1 | Toyota | 1.580 | 1.380 | 14,5% | 38,8% |
| 2 | 5 | Skoda | 348 | 210 | 65,7% | 8,5% |
| 3 | 2 | Hyundai | 289 | 264 | 9,5% | 7,1% |
| 4 | 3 | Ford | 248 | 218 | 13,8% | 6,1% |
| 5 | 4 | Mercedes | 215 | 214 | 0,5% | 5,3% |
| 6 | 13 | Kia | 201 | 67 | 200,0% | 4,9% |
| 7 | 7 | Mitsubishi | 142 | 113 | 25,7% | 3,5% |
| 8 | 9 | Fiat | 139 | 103 | 35,0% | 3,4% |
| 9 | 6 | Renault | 133 | 116 | 14,7% | 3,3% |
| 10 | 11 | Land Rover | 103 | 90 | 14,4% | 2,5% |
| Rank 2018 | Rank 2017 | Sales 2018 | Sales 2017 | '+/- 2018 | Share 2018 | |
|---|---|---|---|---|---|---|
| 1 | 1 | Toyota Group | 1.666 | 1.419 | 17,4% | 40,9% |
| 2 | 3 | Hyundai-Kia | 490 | 331 | 48,0% | 12,0% |
| 3 | 4 | Volkswagen Group | 461 | 329 | 40,1% | 11,3% |
| 4 | 2 | Renault Nissan Alliance | 407 | 398 | 2,3% | 10,0% |
| 5 | 5 | Ford Group | 248 | 218 | 13,8% | 6,1% |
| 6 | 6 | Mercedes Daimler | 215 | 214 | 0,5% | 5,3% |
| 7 | 7 | F.C.A. | 170 | 135 | 25,9% | 4,2% |
| 8 | 8 | Tata | 124 | 102 | 21,6% | 3,0% |
| 9 | 11 | Mazda | 78 | 64 | 21,9% | 1,9% |
| 10 | 9 | Suzuki | 71 | 94 | -24,5% | 1,7% |
| Rank 2018 | Rank 2017 | Model | Sales 2018 | Sales 2017 | '+/- 2018 |
|---|---|---|---|---|---|
| 1 | 5 | Toyota Prado | 381,00 | 154,00 | 1,47 |
| 2 | 10 | Toyota Hilux | 218,00 | 94,00 | 1,32 |
| 3 | 2 | Toyota RAV4 | 213,00 | 202,00 | 0,05 |
| 4 | 6 | Skoda Octavia | 164,00 | 139,00 | 0,18 |
| 4 | 12 | Toyota Camry | 164,00 | 78,00 | 1,10 |
| 5 | 3 | Toyota Corolla | 163,00 | 189,00 | -0,14 |
| 6 | 4 | Toyota C-HR | 159,00 | 171,00 | -0,07 |
| 7 | 16 | Skoda Rapid | 138,00 | 55,00 | 1,51 |
| 8 | 26 | Mitsubishi L200 | 132,00 | 33,00 | 3,00 |
| 9 | 1 | Toyota Land Cruiser | 105,00 | 271,00 | -0,61 |
| 10 | 11 | Lada Niva | 89,00 | 84,00 | 0,06 |


