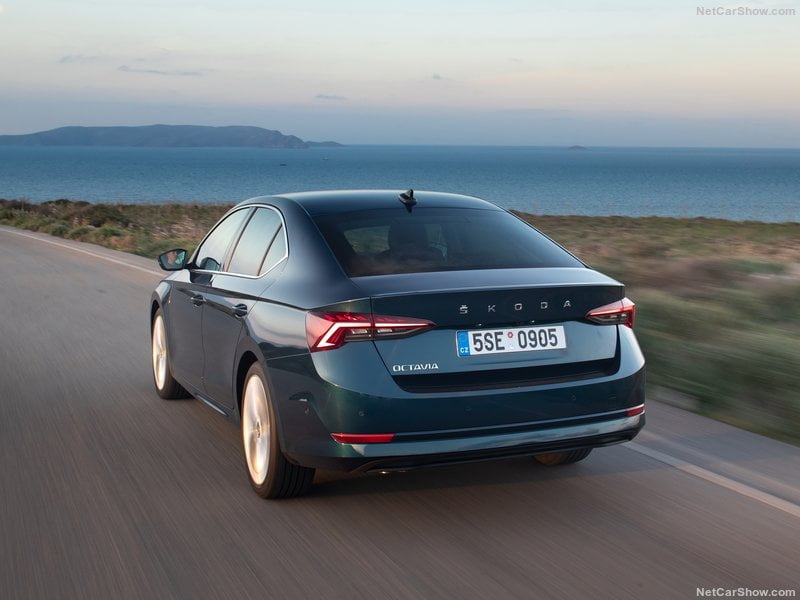
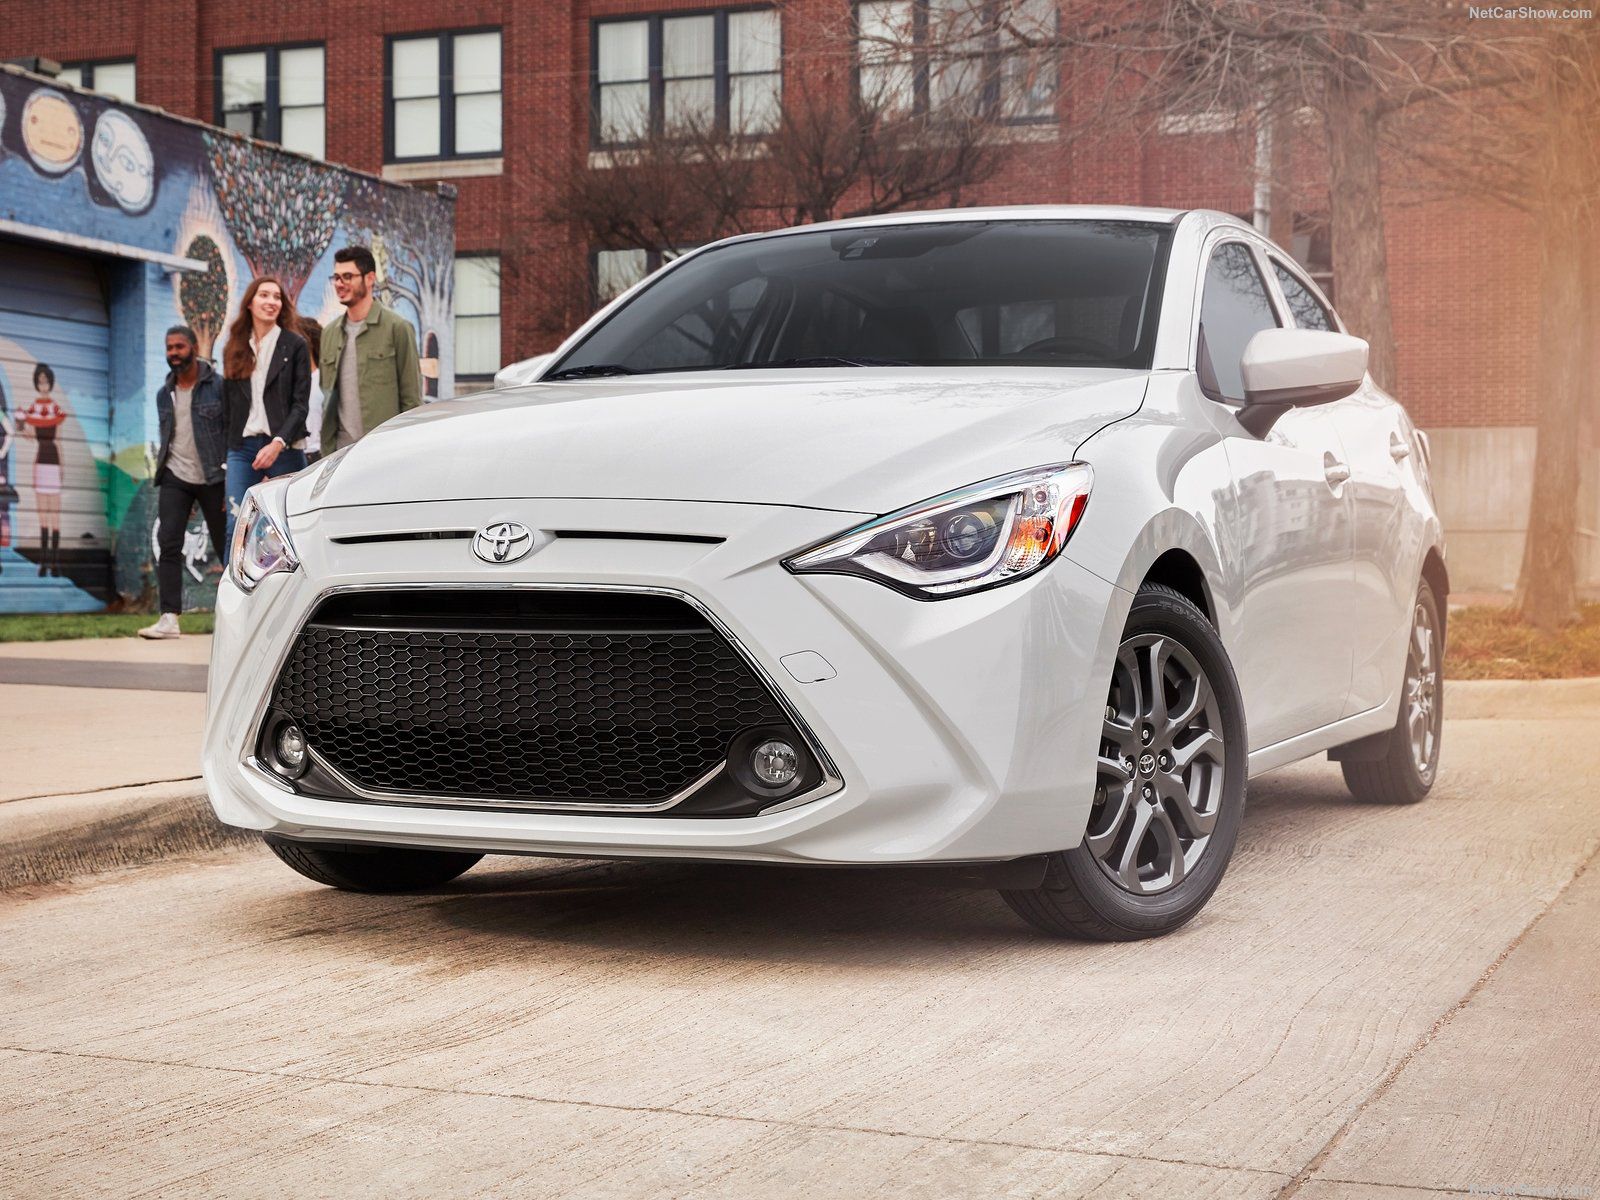
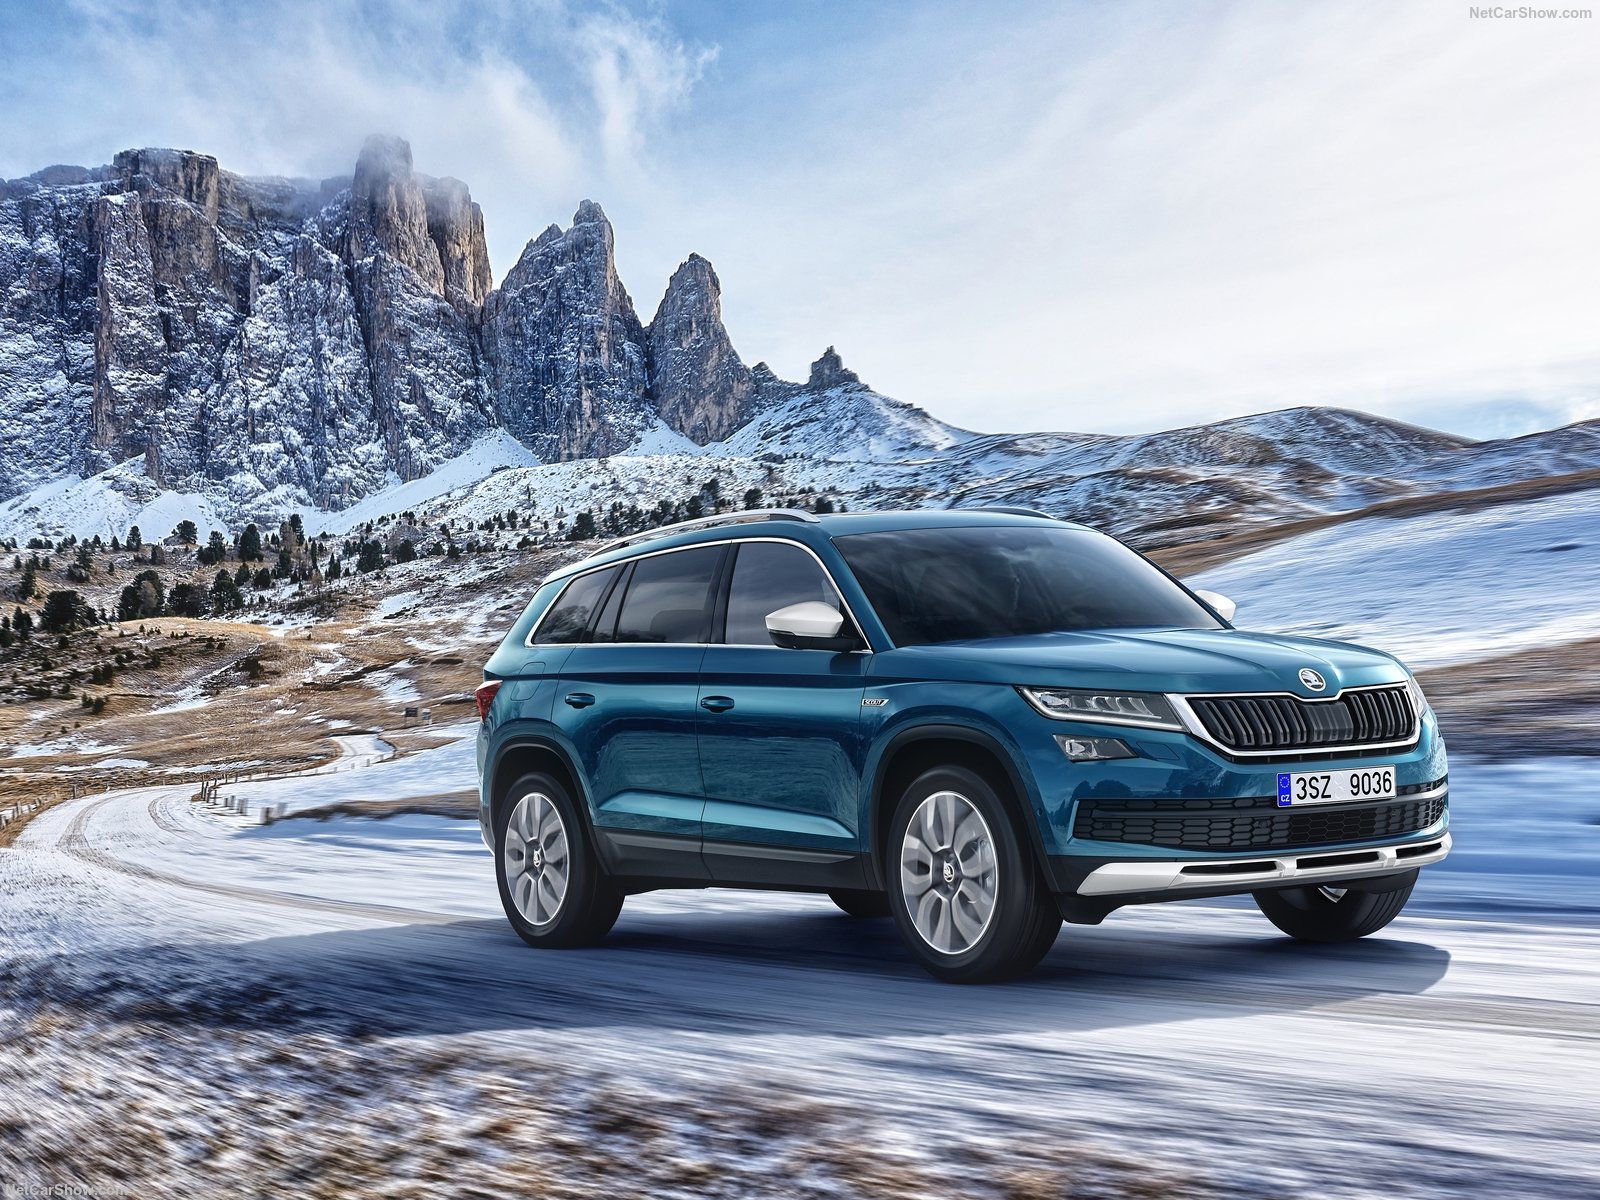
Georgian vehicles market in 2019 has further improved. Indeed, Total sales in 2019 have been 5.670, soaring at 39.2%. Renault was the star of the year, jumping in second position with an impressive trend, while Ford gained the market podium.
Economic Environment
Georgia’s GDP accelerated to an over one-year high of 5.8% in the third quarter (Q2 2019: +4.6% year-on-year) on the back of quickening activity in the wholesale and retail trade sector, and a strong rebound in manufacturing and construction output.
Meanwhile, economic activity growth in October–November firmed up, on average, compared to Q3 amid upbeat gains in manufacturing, hinting that the economy ended 2019 on a strong note. In other news, in mid-December, the IMF approved additional funding of around USD 41.5 million as part of the country’s reform program under the Extended Fund Facility arrangement.
Market Trend
Georgian vehicles market in recent years have been quite stable with total vehicles sales in the 2017 at 3.470, down 1.3% from the previous year. However, despite all positive news from the economic and political side, the development of new vehicles market is still limited by the import of second hands vehicles from others CIS countries. In 2018 the market fully recovered ending the year with registrations at 4.073 (+17.4%) and in 2019 it further improved.
Indeed, Total sales in 2019 have been 5.670, soaring at 39.2%.
In the competitive arena, Toyota – despite having lost over 5 points of share during the last decade – kept dominating, holding 31.7%. Renault was the star of the year, jumping in second position. Indeed, the French brand has grown from 2.8% of share in 2013 to 12.3%.
Ford gained the market podium, ahead of Hyundai, Kia and a fast-growing Lexus.
| Rank 2019 | Rank 2018 | Brand | Sales 2019 | Sales December | +/- YTD | Share 2019 | Share December |
|---|---|---|---|---|---|---|---|
| 1 | 1 | Toyota | 1.795 | 282 | 13,6% | 31,66% | 31,09% |
| 2 | 9 | Renault | 697 | 12 | 424,1% | 12,29% | 1,33% |
| 3 | 4 | Ford | 499 | 76 | 101,2% | 8,80% | 8,39% |
| 4 | 3 | Hyundai | 429 | 64 | 48,4% | 7,57% | 7,10% |
| 5 | 12 | Lexus | 254 | 42 | 195,3% | 4,48% | 4,64% |
| 6 | 6 | Kia | 228 | 16 | 13,4% | 4,02% | 1,75% |
| 7 | 5 | Mercedes | 225 | 44 | 4,7% | 3,97% | 4,87% |
| 8 | 8 | Fiat | 204 | 94 | 46,8% | 3,60% | 10,38% |
| 9 | 10 | Land Rover | 191 | 69 | 85,4% | 3,37% | 7,65% |
| 10 | 2 | Skoda | 189 | 25 | -45,7% | 3,33% | 2,76% |
| 11 | 13 | Mazda | 108 | 25 | 38,5% | 1,90% | 2,76% |
| 12 | 7 | Mitsubishi | 106 | 13 | -25,4% | 1,87% | 1,41% |
| 13 | 14 | Suzuki | 97 | 49 | 36,6% | 1,71% | 5,37% |
| 14 | 19 | Citroen | 73 | 14 | 135,5% | 1,29% | 1,55% |
| 14 | 15 | Porsche | 73 | 13 | 32,7% | 1,29% | 1,46% |
| 15 | 18 | Foton | 49 | 7 | 48,5% | 0,86% | 0,77% |
| 16 | 11 | Lada | 48 | 4 | -49,5% | 0,85% | 0,44% |
| 16 | 21 | BMW | 48 | 5 | 118,2% | 0,85% | 0,54% |
| 17 | 16 | Volkswagen | 47 | 3 | 4,4% | 0,83% | 0,31% |
| 18 | 17 | Nissan | 45 | 9 | 25,0% | 0,79% | 0,97% |
| 19 | 28 | Volvo | 43 | 9 | 1333,3% | 0,76% | 0,99% |
| 20 | 20 | Jeep | 42 | 3 | 82,6% | 0,74% | 0,29% |
| 21 | 23 | Honda | 32 | 10 | 146,2% | 0,56% | 1,07% |
| 22 | 29 | Tesla | 31 | 4 | 1450,0% | 0,55% | 0,44% |
| 23 | 22 | Jaguar | 27 | 4 | 28,6% | 0,48% | 0,40% |
| 24 | 27 | Subaru | 19 | 2 | 375,0% | 0,34% | 0,21% |
| 25 | 24 | Audi | 17 | 4 | 88,9% | 0,30% | 0,43% |
| 26 | 25 | Chevrolet | 16 | 1 | 128,6% | 0,28% | 0,10% |
| 27 | 23 | Peugeot | 10 | 1 | -23,1% | 0,18% | 0,10% |
| 28 | 27 | Bentley | 8 | 1 | 100,0% | 0,14% | 0,10% |
| 29 | 30 | UAZ | 5 | - | 400,0% | 0,09% | 0,00% |
| 30 | 31 | Cadillac | 4 | 1 | 0,07% | 0,11% | |
| 31 | 25 | Mini | 3 | 1 | -57,1% | 0,05% | 0,11% |
| 31 | 26 | Alfa Romeo | 3 | 1 | -40,0% | 0,05% | 0,10% |
| 32 | 27 | JAC | 2 | - | -48,8% | 0,04% | 0,00% |
| 33 | 31 | Dodge | 1 | - | 0,02% | 0,00% | |
| 33 | 28 | Maserati | 1 | - | -66,7% | 0,02% | 0,00% |
| 33 | 31 | Haval | 1 | - | 0,02% | 0,00% |
| Rank 2019 | Rank 2018 | Group | Sales 2019 | Sales December | +/- 2019 | Share 2019 | Share December |
|---|---|---|---|---|---|---|---|
| 1 | 1 | Toyota Group | 2.049 | 323,6 | 23,0% | 36,14% | 35,73% |
| 2 | 4 | Renault Nissan Alliance | 896 | 37,45 | 120,1% | 15,80% | 4,14% |
| 3 | 2 | Hyundai-Kia | 657 | 80,15 | 34,1% | 11,59% | 8,85% |
| 4 | 5 | Ford Group | 499 | 76 | 101,2% | 8,80% | 8,39% |
| 5 | 3 | Volkswagen Group | 334 | 45,85 | -27,5% | 5,89% | 5,06% |
| 6 | 7 | F.C.A. | 251 | 97,55 | 47,6% | 4,43% | 10,77% |
| 7 | 6 | Mercedes Daimler | 225 | 44,1 | 4,7% | 3,97% | 4,87% |
| 8 | 8 | Tata | 218 | 72,9 | 75,8% | 3,84% | 8,05% |
| 9 | 9 | Mazda | 108 | 25 | 38,5% | 1,90% | 2,76% |
| 10 | 10 | Suzuki | 97 | 48,65 | 36,6% | 1,71% | 5,37% |
| Rank 2019 | Rank 2018 | Model | Sales 2019 | 2019 Var |
|---|---|---|---|---|
| 1 | 22 | Renault Duster | 537 | 1434,3% |
| 2 | 3 | Toyota RAV4 | 407 | 91,1% |
| 3 | 5 | Toyota Corolla | 395 | 142,3% |
| 4 | 28 | Ford Ranger | 290 | 974,1% |
| 5 | 6 | Toyota C-HR | 238 | 49,7% |
| 6 | 1 | Toyota Prado | 229 | -39,9% |
| 7 | 4 | Toyota Camry | 204 | 24,4% |
| 8 | 18 | Renault Logan | 192 | 291,8% |
| 9 | 4 | Skoda Octavia | 173 | 5,5% |
| 9 | 29 | Renault Sandero | 173 | 565,4% |
| 10 | 14 | Hyundai Ioniq | 149 | 129,2% |


