Hong Kong Auto sales recovered 13% in the 2017 after the huge drop reported in the previous year, sustained by a more positive economic environment and by demand for green vehicles. Tesla ranked in fourth place.
Hong Kong’s economy expanded by 3.8% year-on-year in real terms in 2017, after growing by 2.1% in 2016. The Government forecasts Hong Kong’s economy to grow by 3-4% in 2018. The value of retail sales, in nominal terms, increased by 2.2% year-on-year in 2017, after the decline of 8.1% for 2016. The labour market conditions remain tight. The seasonally adjusted unemployment rate was 2.9% for the three-month period ending January 2018, compared with 3.4% for 2016. Consumer prices grew 1.7% year-on-year in January 2018, after increasing by 1.5% for 2017.
Hong Kong’s vehicles market reported a recovery after the huge drop scored in the previous year. Indeed, according to data released by the Hong Kong Department of Transportations (HKDT), light vehicles sales have been 30.062, up 13.9%.
| Sales 2012 | Sales 2013 | Sales 2014 | Sales 2015 | Sales 2016 | Sales 2017 | Sales 2018 e | |
|---|---|---|---|---|---|---|---|
| Car+LCV | 34.168 | 38.182 | 44.828 | 47.005 | 26.396 | 30.062 | 25.355 |
| HCV | 8.077 | 8.807 | 8.036 | 8.714 | 4.670 | 7.199 | 6.891 |
| Total | 42.245 | 46.989 | 52.864 | 55.719 | 31.066 | 37.261 | 32.246 |
| 2012 Var | 2013 Var | 2014 Var | 2015 Var | 2016 Var | 2017 Var | 2018 var e | |
|---|---|---|---|---|---|---|---|
| Car+LCV | 9,1% | 11,7% | 17,4% | 4,9% | -43,8% | 13,9% | -15,7% |
| HCV | 9,1% | 9,0% | -8,8% | 8,4% | -46,4% | 54,2% | -4,3% |
| Total | 9,1% | 11,2% | 12,5% | 5,4% | -44,2% | 19,9% | -13,5% |
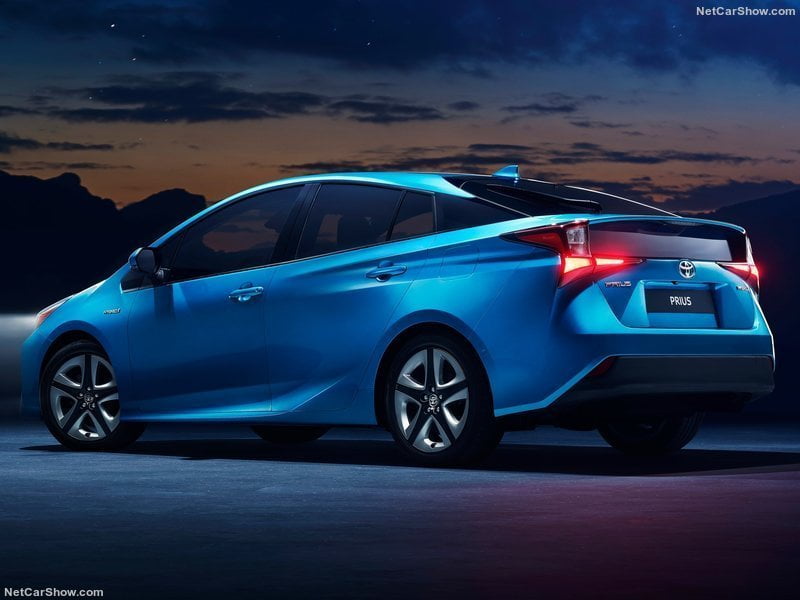
Brand wise, the leadership was solid under Toyota control with 7.242 sales (+10.7%) and 19.4% of market share.
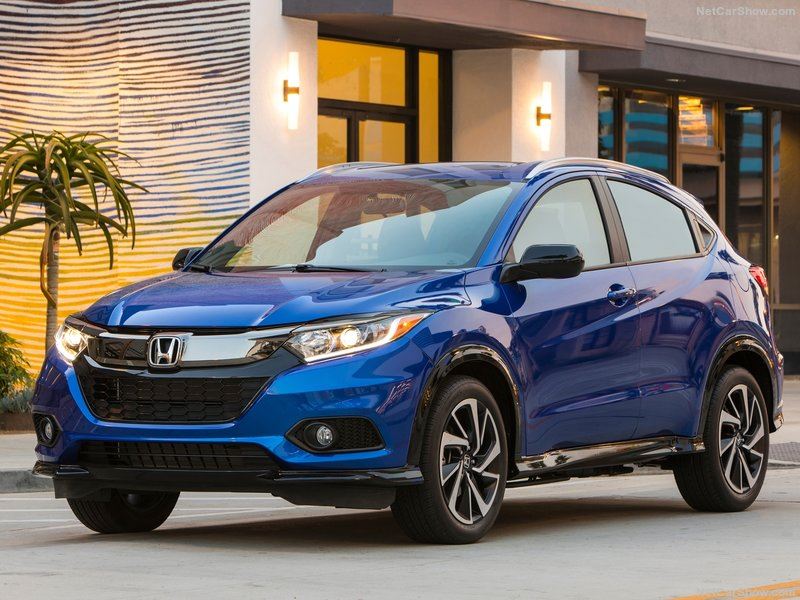
In second place Mercedes with 5.279 units (+6.9%) ahead of BMW with 4.641 (+54.6%), Tesla with 3.729 (+32.8%), Honda with 2.438 (+43.8%) and Audi with 2.297 (+49.3%).
| Rank 2017 | Rank 2016 | Brand | Sales 2017 | Sales 2016 | Variation 2017 | Share 2017 | Share 2016 |
|---|---|---|---|---|---|---|---|
| 1 | 1 | Toyota | 7.242 | 6.542 | 10,7% | 19,4% | 21,1% |
| 2 | 2 | Mercedes | 5.279 | 4.938 | 6,9% | 14,2% | 15,9% |
| 3 | 3 | BMW | 4.641 | 3.003 | 54,5% | 12,5% | 9,7% |
| 4 | 4 | Tesla | 3.729 | 2.807 | 32,8% | 10,0% | 9,0% |
| 5 | 5 | Honda | 2.438 | 1.695 | 43,8% | 6,5% | 5,5% |
| 6 | 6 | Audi | 2.297 | 1.539 | 49,3% | 6,2% | 5,0% |
| 7 | 7 | Volkswagen | 1.671 | 1.302 | 28,3% | 4,5% | 4,2% |
| 8 | 13 | Kia | 1.257 | 537 | 134,1% | 3,4% | 1,7% |
| 9 | 12 | Nissan | 1.156 | 547 | 111,3% | 3,1% | 1,8% |
| 10 | 10 | Lexus | 1.093 | 829 | 31,8% | 2,9% | 2,7% |
| 11 | 8 | Porsche | 1.018 | 1.057 | -3,7% | 2,7% | 3,4% |
| 12 | 11 | Mazda | 958 | 612 | 56,5% | 2,6% | 2,0% |
| 13 | 16 | Land Rover | 655 | 451 | 45,2% | 1,8% | 1,5% |
| 14 | 18 | Mini | 517 | 407 | 27,0% | 1,4% | 1,3% |
| 15 | 19 | Volvo | 513 | 375 | 36,8% | 1,4% | 1,2% |
| 16 | 22 | Subaru | 403 | 251 | 60,6% | 1,1% | 0,8% |
| 17 | 24 | Maserati | 319 | 131 | 143,5% | 0,9% | 0,4% |
| 18 | 14 | Ford | 283 | 509 | -44,4% | 0,8% | 1,6% |
| 19 | 20 | Suzuki | 259 | 341 | -24,0% | 0,7% | 1,1% |
| 20 | 23 | Jaguar | 233 | 183 | 27,3% | 0,6% | 0,6% |
| 21 | 21 | Hyundai | 188 | 272 | -30,9% | 0,5% | 0,9% |
| 22 | 26 | Bentley | 181 | 92 | 96,7% | 0,5% | 0,3% |
| 23 | 30 | Mitsubishi | 165 | 56 | 194,6% | 0,4% | 0,2% |
| 24 | 25 | Infiniti | 149 | 107 | 39,3% | 0,4% | 0,3% |
| 25 | 27 | SsangYong | 140 | 85 | 64,7% | 0,4% | 0,3% |
| 26 | 31 | Renault | 78 | 53 | 47,2% | 0,2% | 0,2% |
| 27 | 34 | Citroen | 75 | 32 | 134,4% | 0,2% | 0,1% |
| 28 | 31 | Lamborghini | 67 | 53 | 26,4% | 0,2% | 0,2% |
| 29 | 29 | Ferrari | 63 | 81 | |||
| 30 | 32 | Smart | 61 | 39 | |||
| 31 | 38 | Aston Martin | 33 | 14 | |||
| 32 | 35 | Rolls-Royce | 29 | 26 | |||
| 33 | 33 | McLaren | 21 | 37 | |||
| 34 | 28 | Fiat | 19 | 83 | |||
| 35 | 32 | Alfa Romeo | 14 | 39 | |||
| 36 | 40 | Maxus | 8 | 5 | |||
| 37 | 37 | Jeep | 4 | 21 | |||
| 38 | 41 | BYD | 3 | 2 | |||
| 39 | 41 | Daihatsu | 2 | 2 |


