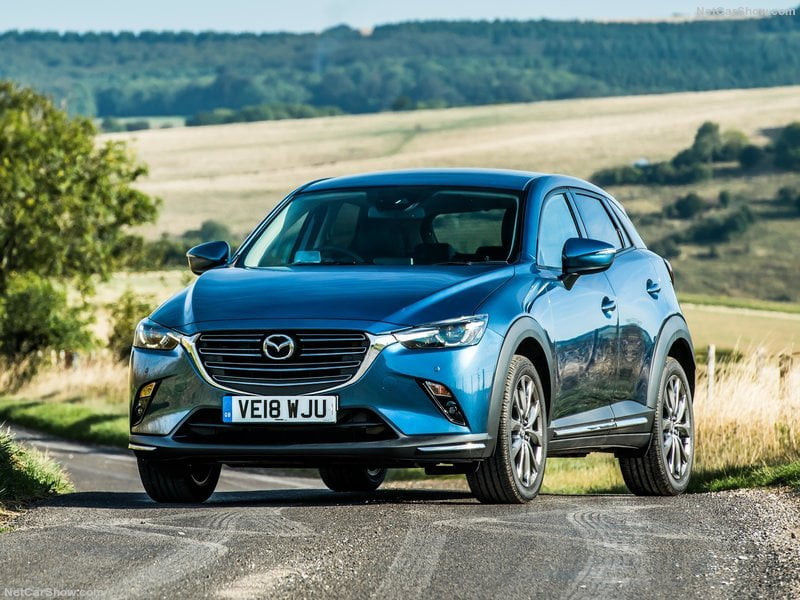
Icelandic cars market in 2019 was hit by another large drop. Total sales have been 13.065, crumbling down 26.9%. The market leader was still Toyota with 16.4% of share, still holding a wide gap from Kia and Volkswagen.
Economic Environment
Iceland economy contracted slightly in the third quarter after briefly recovering in the second quarter. Exports of goods and services plunged in Q3 on falling tourist arrivals, as the collapse of WOW air earlier this year continued to depress the tourism sector. On a more positive note, consumer spending picked up in Q3, while fixed investment recovered, buttressed by robust residential investment and despite declining business investment.
Turning to the fourth quarter, the economy likely remained on a feeble footing. While fiscal stimulus and more accommodative monetary conditions should have fed through to domestic demand, ongoing uncertainty in the tourism sector likely continued to stall investment plans and drag on services exports. Moreover, the total fish catch, a key export earner, shrank sharply in annual terms in November.
Market Trend
The automotive industry has been on a positive track from 2014 to 2017m when it hit the highest volume since 2009. However, in 2018 the market suffered a hard drop of 15.7% and car passenger’s sales have been 17.871, much less than the previous year’s 21.204.
In 2019, According to data released by the Minister of Transportation, the market trend even worsened. Indeed, Total sales have been 13.065 (-26.9%).
Despite having lost over 6 points of share in the last 10 years, the market leader in 2019 was again Toyota with 16.4% of share, still holding a wide gap from Kia and Volkswagen, respectively with 11.4% and 7.5%.
Service Solutions
Since 2010, focus2move.com is a specialist in the automotive industry tracking monthly sales for all brands and models in the widest in the World range of countries, actually over 150. From this huge database we can extract data sorted under your own conditions and deliver historical data in excel.
If you like to receive historical data or to subscribe at monthly update, contact us at kventura@focus2move.com and we will arrange a short video call. By showing you our database and segmentation, we can find together the best solutions for your team.
| Rank 2019 | Rank 2018 | Brand | Sales 2019 | Sales December | +/- YTD | Share 2019 | Share December |
|---|---|---|---|---|---|---|---|
| 1 | 1 | Toyota | 2.142 | 164 | -26,1% | 16,39% | 17,15% |
| 2 | 2 | Kia | 1.486 | 114 | -26,0% | 11,37% | 11,92% |
| 3 | 5 | Volkswagen | 975 | 74 | -8,0% | 7,46% | 7,74% |
| 4 | 4 | Nissan | 826 | 63 | -27,4% | 6,32% | 6,59% |
| 5 | 3 | Hyundai | 805 | 61 | -46,2% | 6,16% | 6,38% |
| 6 | 12 | Dacia | 700 | 12 | 10,2% | 5,36% | 1,26% |
| 7 | 8 | Ford | 634 | 48 | -8,6% | 4,85% | 5,02% |
| 8 | 10 | Suzuki | 579 | 44 | -14,9% | 4,43% | 4,60% |
| 9 | 6 | Mazda | 543 | 41 | -39,9% | 4,16% | 4,29% |
| 10 | 9 | Renault | 485 | 37 | -29,0% | 3,71% | 3,87% |
| 11 | 7 | Mitsubishi | 472 | 36 | -46,8% | 3,61% | 3,77% |
| 12 | 11 | Skoda | 445 | 34 | -32,9% | 3,41% | 3,56% |
| 13 | 13 | Volvo | 418 | 32 | -31,1% | 3,20% | 3,35% |
| 14 | 17 | Mercedes | 363 | 28 | 1,0% | 2,78% | 2,93% |
| 15 | 14 | Honda | 353 | 27 | -21,0% | 2,70% | 2,82% |
| 16 | 15 | Peugeot | 262 | 20 | -36,3% | 2,01% | 2,09% |
| 17 | 18 | Land Rover | 247 | 19 | -25,5% | 1,89% | 1,99% |
| 18 | 16 | Subaru | 195 | 15 | -49,2% | 1,49% | 1,57% |
| 19 | 21 | BMW | 175 | 13 | -21,2% | 1,34% | 1,36% |
| 20 | 23 | Citroen | 169 | 13 | -6,1% | 1,29% | 1,36% |
| 21 | 19 | Audi | 166 | 13 | -45,6% | 1,27% | 1,36% |
| 22 | 22 | Opel | 126 | 10 | -37,6% | 0,96% | 1,05% |
| 23 | 20 | SsangYong | 103 | 8 | -61,7% | 0,79% | 0,84% |
| 24 | 29 | Jaguar | 86 | 7 | 94,0% | 0,66% | 0,73% |
| 25 | 24 | Jeep | 77 | 6 | -26,5% | 0,59% | 0,63% |
| 26 | 26 | Fiat | 71 | 5 | 20,3% | 0,54% | 0,52% |
| 27 | 25 | Lexus | 61 | 5 | -19,4% | 0,47% | 0,52% |
| 28 | 32 | Tesla | 44 | 3 | 1366,7% | 0,34% | 0,31% |
| 29 | 28 | Porsche | 30 | 2 | -43,4% | 0,23% | 0,21% |
| 30 | 34 | Isuzu | 22 | 2 | 0,17% | 0,21% | |
| 31 | 30 | Dodge | 4 | - | 0,03% | 0,00% | |
| 32 | 34 | Chrysler | 1 | - | 0,01% | 0,00% |
| Rank 2019 | Rank 2018 | Group | Sales 2019 | Sales December | +/- 2019 | Share 2019 | Share December |
|---|---|---|---|---|---|---|---|
| 1 | 2 | Renault Nissan Alliance | 2.483 | 148 | -25,7% | 19,00% | 15,48% |
| 2 | 1 | Hyundai-Kia | 2.291 | 175 | -34,6% | 17,54% | 18,31% |
| 3 | 3 | Toyota Group | 2.203 | 169 | -26,0% | 16,86% | 17,68% |
| 4 | 4 | Volkswagen Group | 1.616 | 123 | -22,3% | 12,37% | 12,87% |
| 5 | 7 | Ford Group | 634 | 48 | -8,6% | 4,85% | 5,02% |
| 6 | 8 | Suzuki | 579 | 44 | -14,9% | 4,43% | 4,60% |
| 7 | 6 | P.S.A. | 557 | 43 | -29,8% | 4,26% | 4,50% |
| 8 | 5 | Mazda | 543 | 41 | -39,9% | 4,16% | 4,29% |
| 9 | 9 | Geely Group | 418 | 32 | -31,1% | 3,20% | 3,35% |
| 10 | 13 | Mercedes Daimler | 363 | 28 | 1,0% | 2,78% | 2,93% |
| Rank 2019 | Model | Sales 2019 | 2019 Var | December Sales | December var |
|---|---|---|---|---|---|
| 1 | Toyota RAV4 | 696 | 101,7% | 53 | 89,3% |
| 2 | Dacia Duster | 553 | 326,2% | 42 | 600,0% |
| 3 | Mitsubishi Outlander | 418 | -46,3% | 32 | -50,0% |
| 4 | Kia Sportage | 320 | 66,7% | 24 | 50,0% |
| 5 | Toyota Land Cruiser | 300 | -13,0% | 23 | -17,9% |
| 6 | Volkswagen Golf | 279 | -19,4% | 21 | -25,0% |
| 7 | Kia Ceed | 263 | 94,8% | 22 | 69,2% |
| 8 | Nissan Qashqai | 245 | -2,4% | 19 | -5,0% |
| 9 | Toyota Yaris | 231 | -20,1% | 18 | -28,0% |
| 10 | Honda CR-V | 225 | 48,0% | 17 | 30,8% |


