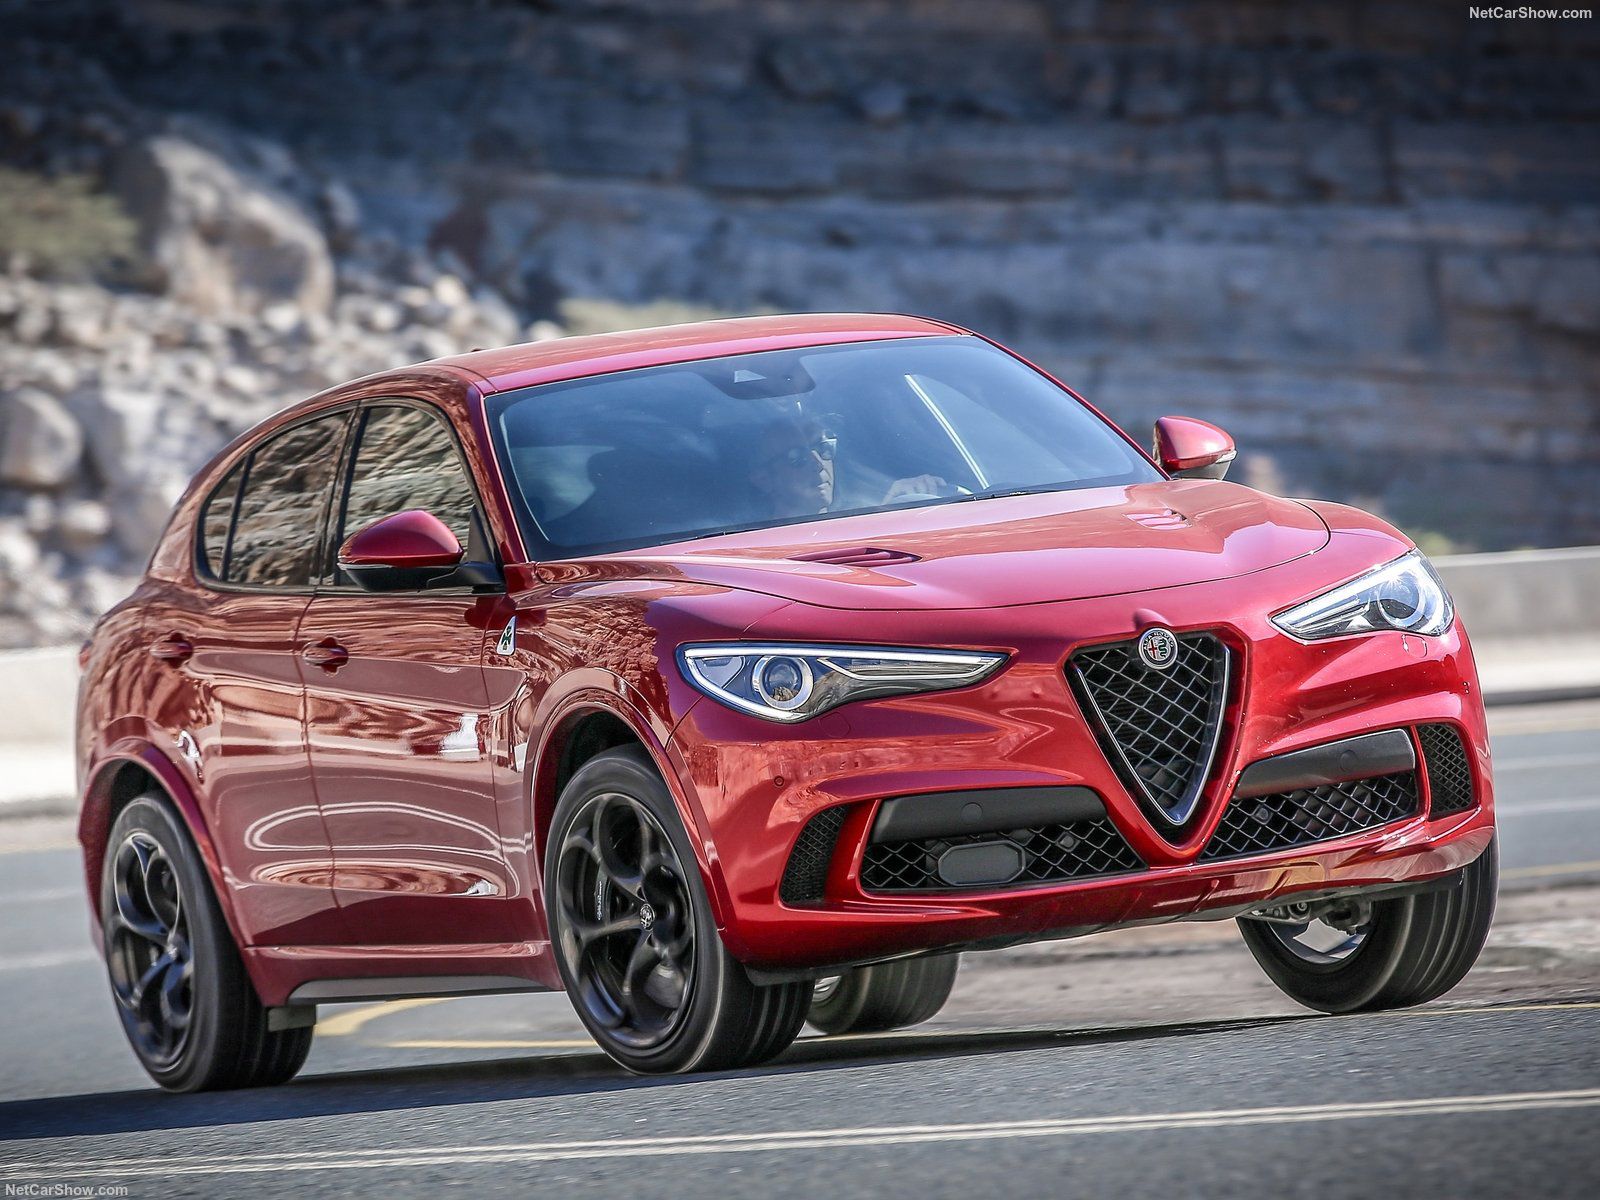
Italian Autos Market went down 2.6% in 2018 closing the year with 1.918.526 sales, interrupting the steady growth of the previous years. Fiat – down 19.5% – has eroded its market share below 20%. Jeep Renegade scored an astonishing performance.
Economic Environment
The economy contracted in the third quarter for the first time since the fourth quarter of 2014. The poor showing was led by unrest in financial markets amid the turbulent political situation—which tightened financing conditions and hit business confidence—as well by a modest performance from the labor market.
The industrial sector remained weak in October, business confidence continued to decline in October-November and consumer confidence dropped in November, although retail sales regained some steam from the previous month. The negative effects of higher interest rates on the capitalization of the banking system are also constricting credit.
Growth is expected to be anemic next year. Domestic demand will likely expand at a modest pace, restrained by structural weaknesses, higher interest rates, muted productivity, weak wage growth and slowing job gains due to the implementation of tighter labor laws. Moreover, given the unstable political situation, financial turbulence could resurface, exacerbating the country’s high debt risk profile and problems within the banking system.
Market Trend
Italian vehicles market fell down in the period 2008-2011 hitting a thirty years record low, before starting to recover. In the last 5 years car passenger’s volume grew up from 1.4 million in the 2012 to 1.8 million in the 2016 and finally at 1.964.000 in the 2017, when the total light vehicles figures hit the 2.14 million units.
The market long recovery is ended in the 2018, considering the car park density in Italy is the highest in Europe and within the top 5 worldwide.
Data released by the Italian Minister of Transportation reported that the market has ended with 1918.526 sales. The steady growth of past years has stopped, with a decline of 2.6% this year. The deadline of September 1st for introduction of WLTP emission standard, moved up and down the registrations data in single Q3 months, but not as in others EU countries.
| Sales 2014 | Sales 2015 | Sales 2016 | Sales 2017 | Sales 2018 | '+/- 2018 |
|---|---|---|---|---|---|
| 1.368.979 | 1.583.596 | 1.834.908 | 1.970.377 | 1.918.526 | -2,6% |
Competitive Arena
The market has been always heavily conditioned by the strategy of Fiat Group, now FCA, which in the ’80 and ’90 had firmly stopped the start up of foreign industrial facilities, when Japanese brands were looking for South European location to produce. Then, in more recent years, FCA has almost left the country, with just 800.000 vehicles produced locally (near the half for export).
As far as sales, FCA has controlled always a near 30% of share, also with dumping strategies. In the last months a surprising strategy is in place and thanks to the success of Jeep models, FCA is shifting sales from Fiat brand to Jeep, a more profitable “premium” brand.
That’s the reason of the decline of Fiat, still market leader in 2018, of course, but with a share well below the 20% usually considered the lower limit in Turin HQs. Indeed, year to date, Fiat sold 323.342 cars (-19.5%).
In second place there is Volkswagen with 162.775 sales (+12.3%) followed by Ford, with 129.563 (-3.4%) and Renault with 125.154 (-6.4%).
In fifth place Peugeot, at the best place in years, with 108.468 (+4%) followed by Opel with 95.290 (-3.7%), Toyota with 87.833 (+3%), Jeep with 84.535 (+70.8%), Citroen up 5.9% with 82.846 units and in 10th place Audi with 62.776 (-6.4%).
In 18th place Alfa Romeo, with 43.112 sales, down 4.9%, despite the last year launch of Stelvio and Giulia, confirming the absolute inability of FCA to re-launch the brand, any day closer to be sold at a German player.
As far as best selling models, the Fiat Panda is the leader since 7 years, having lost the leadership in favor of Renault Clio in this August, for one-shot reasons related to WLTP registrations. Panda sales have been 124.266 (-14.9%) and is followed by the Renault Clio, best imported model, with 51.628 (-1.9%) the Fiat 500 X with 49.931 (+9%), the Lancia Ypsilon with 48.555 (-19.5%) and the Jeep Renegade with 41.960 (+11.5%).
To see the full best-selling models ranking report for Italy, please refer to the specific article here.
Research, Consulting, Data & Forecast
F2M covers intensively this market with several products developed to help any investigation required. Market Researches in PDF are immediately available for download with study on the market since 2005 and with forecast up to the 2025. AutoData in EXCEL are immediately downloadable with annual sales volume, split by month, for all brands and all models distributed in the market. This year data are released year to date, but you will receive a monthly update until the year-end. See details within Italy Corner Store!
| Rank 2018 | Rank 2017 | Sales 2018 | Sales 2017 | '+/- 2018 | |
|---|---|---|---|---|---|
| 1 | 1 | Fiat | 323.342 | 401.437 | -19,5% |
| 2 | 2 | Volkswagen | 162.775 | 144.885 | 12,3% |
| 3 | 3 | Ford | 129.563 | 134.124 | -3,4% |
| 4 | 4 | Renault | 125.154 | 133.715 | -6,4% |
| 5 | 5 | Peugeot | 108.468 | 104.274 | 4,0% |
| 6 | 6 | Opel | 95.290 | 98.979 | -3,7% |
| 7 | 7 | Toyota | 87.833 | 85.245 | 3,0% |
| 8 | 16 | Jeep | 84.535 | 49.503 | 70,8% |
| 9 | 8 | Citroen | 82.846 | 78.225 | 5,9% |
| 10 | 9 | Audi | 62.776 | 67.103 | -6,4% |
| 11 | 15 | Dacia | 61.599 | 58.011 | 6,2% |
| 12 | 10 | Mercedes | 61.318 | 65.971 | -7,1% |
| 13 | 12 | BMW | 57.121 | 60.894 | -6,2% |
| 14 | 11 | Nissan | 54.606 | 62.724 | -12,9% |
| 15 | 14 | Hyundai | 53.445 | 58.934 | -9,3% |
| 16 | 13 | Lancia | 48.557 | 60.341 | -19,5% |
| 17 | 17 | Kia | 47.739 | 47.957 | -0,5% |
| 18 | 18 | Alfa Romeo | 43.112 | 45.333 | -4,9% |
| 19 | 19 | Suzuki | 32.939 | 31.093 | 5,9% |
| 20 | 22 | Skoda | 25.377 | 23.129 | 9,7% |
| 21 | 20 | Smart | 24.629 | 26.665 | -7,6% |
| 22 | 21 | Mini | 20.529 | 24.724 | -17,0% |
| 23 | 24 | Seat | 19.951 | 17.528 | 13,8% |
| 24 | 25 | Volvo | 19.075 | 16.970 | 12,4% |
| 25 | 23 | Land Rover | 17.356 | 18.676 | -7,1% |
| 26 | 26 | Mazda | 10.866 | 10.530 | 3,2% |
| 27 | 37 | Abarth | 10.340 | 593 | 1643,7% |
| 28 | 29 | Jaguar | 9.257 | 5.316 | 74,1% |
| 29 | 27 | Honda | 8.859 | 9.875 | -10,3% |
| 30 | 31 | Mitsubishi | 6.008 | 3.755 | 60,0% |
| 31 | 28 | Porsche | 5.290 | 5.492 | -3,7% |
| 32 | 30 | Lexus | 3.974 | 4.003 | -0,7% |
| 33 | 32 | Subaru | 3.387 | 3.085 | 9,8% |
| 34 | 33 | Maserati | 2.762 | 2.918 | -5,3% |
| 35 | 34 | DS | 2.663 | 2.654 | 0,3% |
| 36 | 35 | SsangYong | 2.465 | 2.244 | 9,8% |
| 37 | 38 | DR | 1.465 | 410 | 257,3% |
| 38 | 41 | Mahindra | 900 | 283 | 218,0% |
| 39 | 36 | Infiniti | 600 | 1.853 | -67,6% |
| 40 | 40 | Tesla | 464 | 318 | 45,9% |
| 41 | 39 | Ferrari | 399 | 344 | 16,0% |
| 42 | 42 | Lamborghini | 212 | 133 | 59,4% |
| 43 | 45 | Lada | 60 | 36 | 66,7% |
| 44 | 43 | Chevrolet | 51 | 53 | -3,8% |
| 45 | 44 | Aston Martin | 28 | 41 | -31,7% |
| Rank 2018 | Rank 2017 | Sales 2018 | Sales 2017 | '+/- 2018 | Share 2018 | |
|---|---|---|---|---|---|---|
| 1 | 1 | F.C.A. | 513.047 | 560.469 | -8,5% | 26,7% |
| 2 | 2 | P.S.A. | 289.267 | 284.132 | 1,8% | 15,1% |
| 3 | 4 | Volkswagen Group | 276.389 | 258.270 | 7,0% | 14,4% |
| 4 | 3 | Renault Nissan Alliance | 248.027 | 260.094 | -4,6% | 12,9% |
| 5 | 5 | Ford Group | 129.563 | 134.124 | -3,4% | 6,8% |
| 6 | 6 | Hyundai-Kia | 101.184 | 106.891 | -5,3% | 5,3% |
| 7 | 8 | Toyota Group | 91.807 | 89.248 | 2,9% | 4,8% |
| 8 | 7 | Mercedes Daimler | 85.947 | 92.636 | -7,2% | 4,5% |
| 9 | 9 | BMW | 77.652 | 85.618 | -9,3% | 4,0% |
| 10 | 10 | Suzuki | 32.939 | 31.093 | 5,9% | 1,7% |
| Rank 2018 | Rank 2017 | Model | Sales 2018 | Sales 2017 | '+/- 2018 |
|---|---|---|---|---|---|
| 1 | 1 | Fiat Panda | 124.266 | 146.076 | -14,9% |
| 2 | 5 | Renault Clio | 51.628 | 52.646 | -1,9% |
| 3 | 7 | Fiat 500x | 49.931 | 45.795 | 9,0% |
| 4 | 2 | Lancia Ypsilon | 48.555 | 60.320 | -19,5% |
| 5 | 12 | Jeep Renegade | 41.960 | 37.641 | 11,5% |
| 6 | 8 | Citroen C3 | 41.584 | 42.342 | -1,8% |
| 7 | 11 | Volkswagen Polo | 41.086 | 39.499 | 4,0% |
| 8 | 3 | Fiat Tipo | 40.337 | 56.046 | -28,0% |
| 9 | 4 | Fiat 500 | 39.885 | 53.966 | -26,1% |
| 10 | 9 | Ford Fiesta | 39.681 | 41.292 | -3,9% |
| 11 | 14 | Toyota Yaris | 39.416 | 36.975 | 6,6% |
| 12 | 75 | Jeep Compass | 38.900 | 7.670 | 407,2% |
| 13 | 10 | Volkswagen Golf | 35.472 | 39.661 | -10,6% |
| 14 | 6 | Fiat 500L | 34.064 | 46.461 | -26,7% |
| 15 | 15 | Peugeot 208 | 33.557 | 36.726 | -8,6% |
| 16 | 18 | Volkswagen Tiguan | 30.545 | 29.169 | 4,7% |
| 17 | 17 | Renault Captur | 29.620 | 29.903 | -0,9% |
| 18 | 16 | Nissan Qashqai | 29.466 | 31.353 | -6,0% |
| 19 | 21 | Dacia Sandero | 29.459 | 27.662 | 6,5% |
| 20 | 26 | Ford Ecosport | 28.519 | 19.246 | 48,2% |
| 21 | 22 | Dacia Duster | 27.657 | 24.574 | 12,5% |
| 22 | 30 | Peugeot 3008 | 24.546 | 16.860 | 45,6% |
| 23 | 195 | volkswagen T-Roc | 23.661 | 568 | 4065,7% |
| 24 | 19 | Opel Corsa | 22.379 | 28.795 | -22,3% |
| 25 | 23 | Peugeot 2008 | 21.980 | 23.343 | -5,8% |
| 26 | 13 | Fiat Punto | 21.302 | 37.259 | -42,8% |
| 27 | 32 | Toyota C-HR | 18.919 | 16.620 | 13,8% |
| 28 | 20 | Opel Mokka | 18.849 | 28.123 | -33,0% |
| 29 | 48 | Opel Karl | 18.610 | 10.840 | 71,7% |
| 30 | 33 | Volkswagen Up! | 18.223 | 16.206 | 12,4% |


