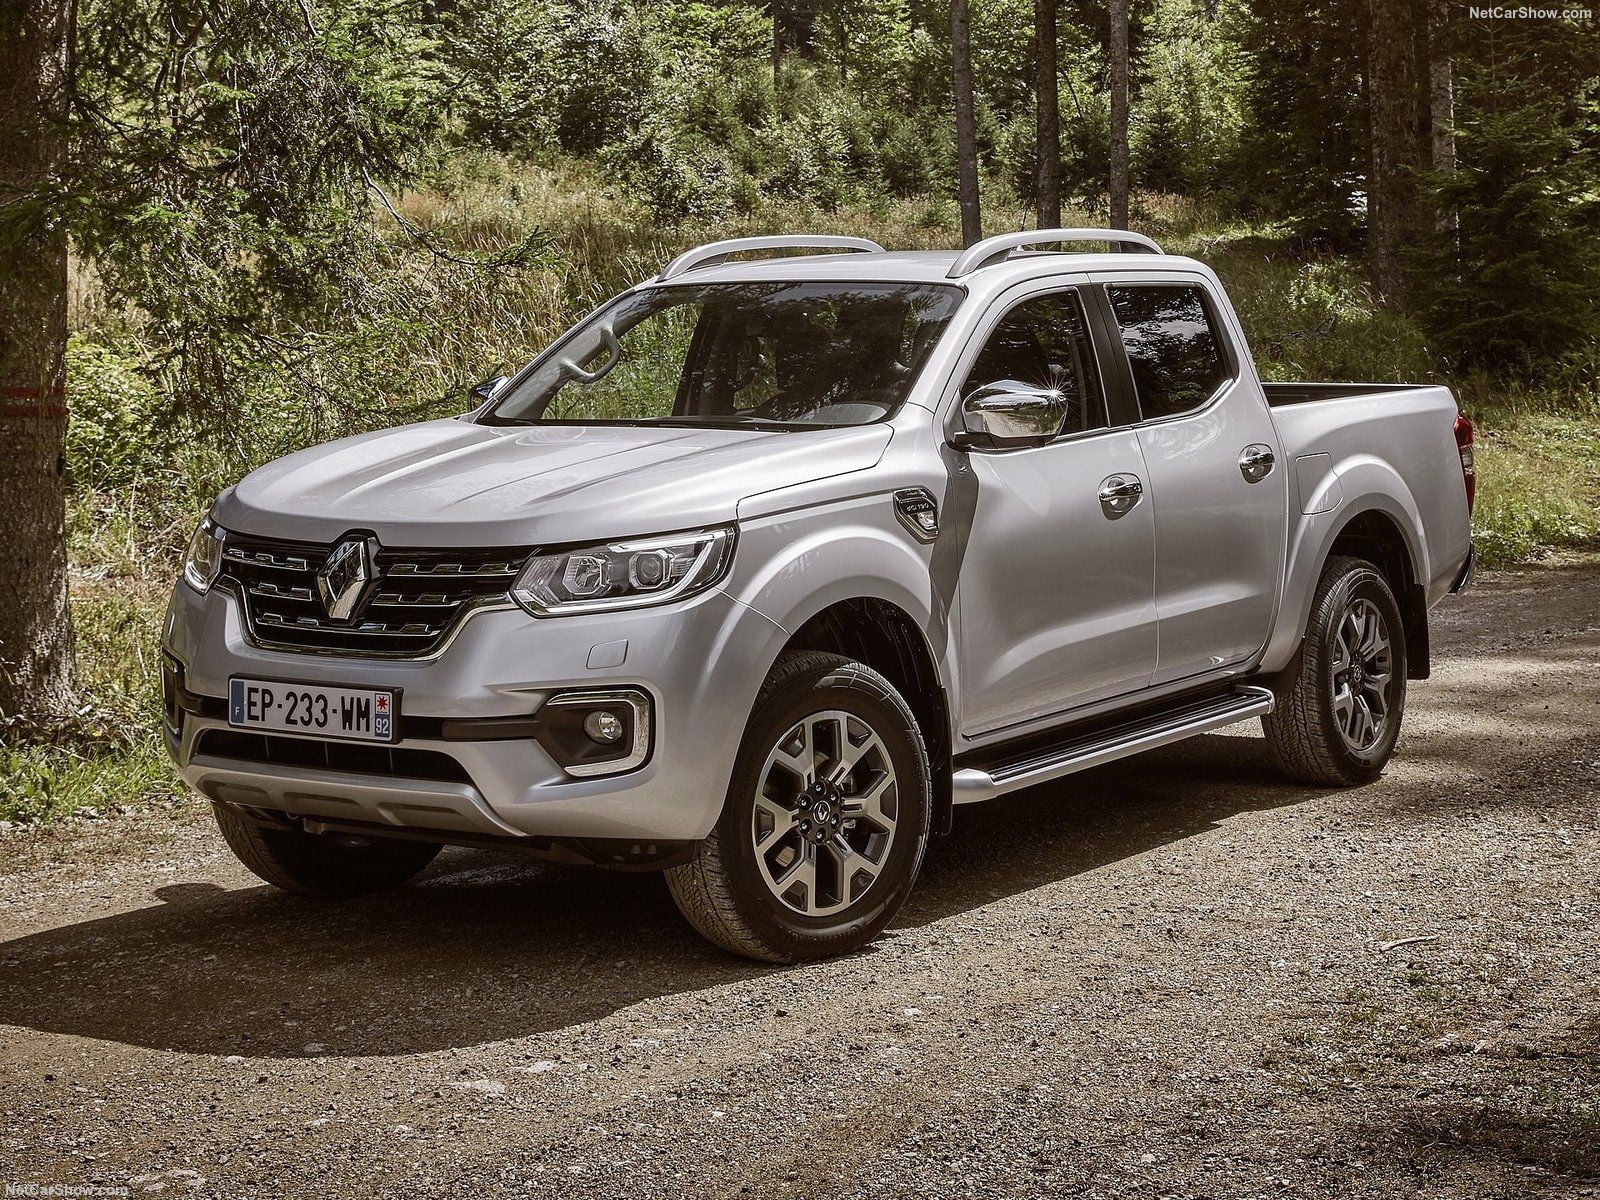
Ivory Coast Car Market in 2017 kept momentum improving near 9% with the country among the fastest growing in Africa with GDP up 8%. While the market leader Toyota has lost sales for the second year, Renault jumped in second place.
Côte d’Ivoire’s economic performance has been impressive over the past years with a robust GDP growth which resulted in a decline in poverty. Throughout 2017, the country’s annual growth estimates hovered around 8%. A large part of the plan is the ambition to go from the world’s largest raw cocoa exporter to actually manufacturing and marketing its own chocolate and while steps have been down in this way, declined prices of raw material have did not help.
New vehicles market development was steady in recent years with volume grew up from 7.500 in the 2012 to 9.796 in the 2017, of which near 10% represented by HCVs.
| Sales 2012 | Sales 2013 | Sales 2014 | Sales 2015 | Sales 2016 | Sales 2017 | Sales 2018 e | |
|---|---|---|---|---|---|---|---|
| Car+LCV | 7.500 | 7.624 | 7.641 | 8.533 | 8.235 | 8.970 | 10.604 |
| HCV | - | - | - | - | 678 | 826 | 826 |
| Total | 7.500 | 7.624 | 7.641 | 8.533 | 8.913 | 9.796 | 11.430 |
| 2012 Var | 2013 Var | 2014 Var | 2015 Var | 2016 Var | 2017 Var | 2018 var e | |
|---|---|---|---|---|---|---|---|
| Car+LCV | 36,5% | 1,7% | 0,2% | 11,7% | -3,5% | 8,9% | 18,2% |
| HCV | 21,8% | 0,0% | |||||
| Total | 36,5% | 1,7% | 0,2% | 11,7% | 4,5% | 9,9% | 16,7% |
Despite losing 4.9% and for the second year in a row, Toyota stands on tp of the market with 1.618 sales and 16.5% of market share. However, in these year a strong player raised in second place with the announced ambition to gain the leadership. It is Renault, actually second with 1.185 units (+20.9%) and 12.1% of share.
In third place Mitsubishi with 905 (-6.6%).
At model wise, the best-selling was the Toyota Hilux with 694 sales (+1.2%) ahead of the Mitsubishi L200 with 598 (+43.1%) and in third the Renault Duster with 431 (-4.9%).
Research, Consulting, Data & Forecast
F2M covers intensively this market with several products developed to help any investigation required. Market Researches in PDF are immediately available for download with study on the market since 2005 and with forecast up to the 2022. Auto Data in EXCEL are immediately downloadable with annual sales volume, split by month, for all brands and all models distributed in the market. This year data are released year to date, but you will receive a monthly update until the year-end. All these and more within our Ivory Coast Store
| Rank 2017 | Rank 2016 | Brand | Sales 2017 | Sales 2016 | Variation 2017 | Share 2017 | Share 2016 |
|---|---|---|---|---|---|---|---|
| 1 | 1 | Toyota | 1.618 | 1.702 | -4,9% | 16,5% | 19,1% |
| 2 | 3 | Renault | 1.185 | 980 | 20,9% | 12,1% | 11,0% |
| 3 | 4 | Mitsubishi | 905 | 849 | 6,6% | 9,2% | 9,5% |
| 4 | 2 | Hyundai | 801 | 1.071 | -25,2% | 8,2% | 12,0% |
| 5 | 7 | Nissan | 735 | 450 | 63,3% | 7,5% | 5,0% |
| 6 | 12 | Suzuki | 653 | 222 | 194,1% | 6,7% | 2,5% |
| 7 | 5 | Ford | 479 | 547 | -12,4% | 4,9% | 6,1% |
| 7 | 6 | Mazda | 479 | 496 | -3,4% | 4,9% | 5,6% |
| 8 | 9 | Great Wall | 367 | 294 | 24,8% | 3,7% | 3,3% |
| 9 | 10 | Kia | 360 | 273 | 31,9% | 3,7% | 3,1% |
| Rank 2017 | Rank 2016 | Sales 2017 | Sales 2016 | Variation 2017 | |
|---|---|---|---|---|---|
| 1 | 1 | Toyota Hilux | 694 | 686 | 1,2% |
| 2 | 3 | Mitsubishi L200 | 598 | 418 | 43,1% |
| 3 | 2 | Renault Duster | 431 | 453 | -4,9% |
| 4 | 8 | Nissan Hardbody | 314 | 192 | 63,5% |
| 5 | 4 | Mazda BT-50 | 300 | 367 | -18,3% |
| 6 | 13 | Nissan Qashqai | 265 | 165 | 60,6% |
| 7 | 16 | Kia Sportage | 254 | 147 | 72,8% |
| 8 | 38 | Suzuki Vitara | 237 | 49 | 383,7% |
| 9 | 9 | Great Wall Wingle | 230 | 187 | 23,0% |
| 10 | 15 | Mitsubishi Fuso Canter | 228 | 150 | 52,0% |


