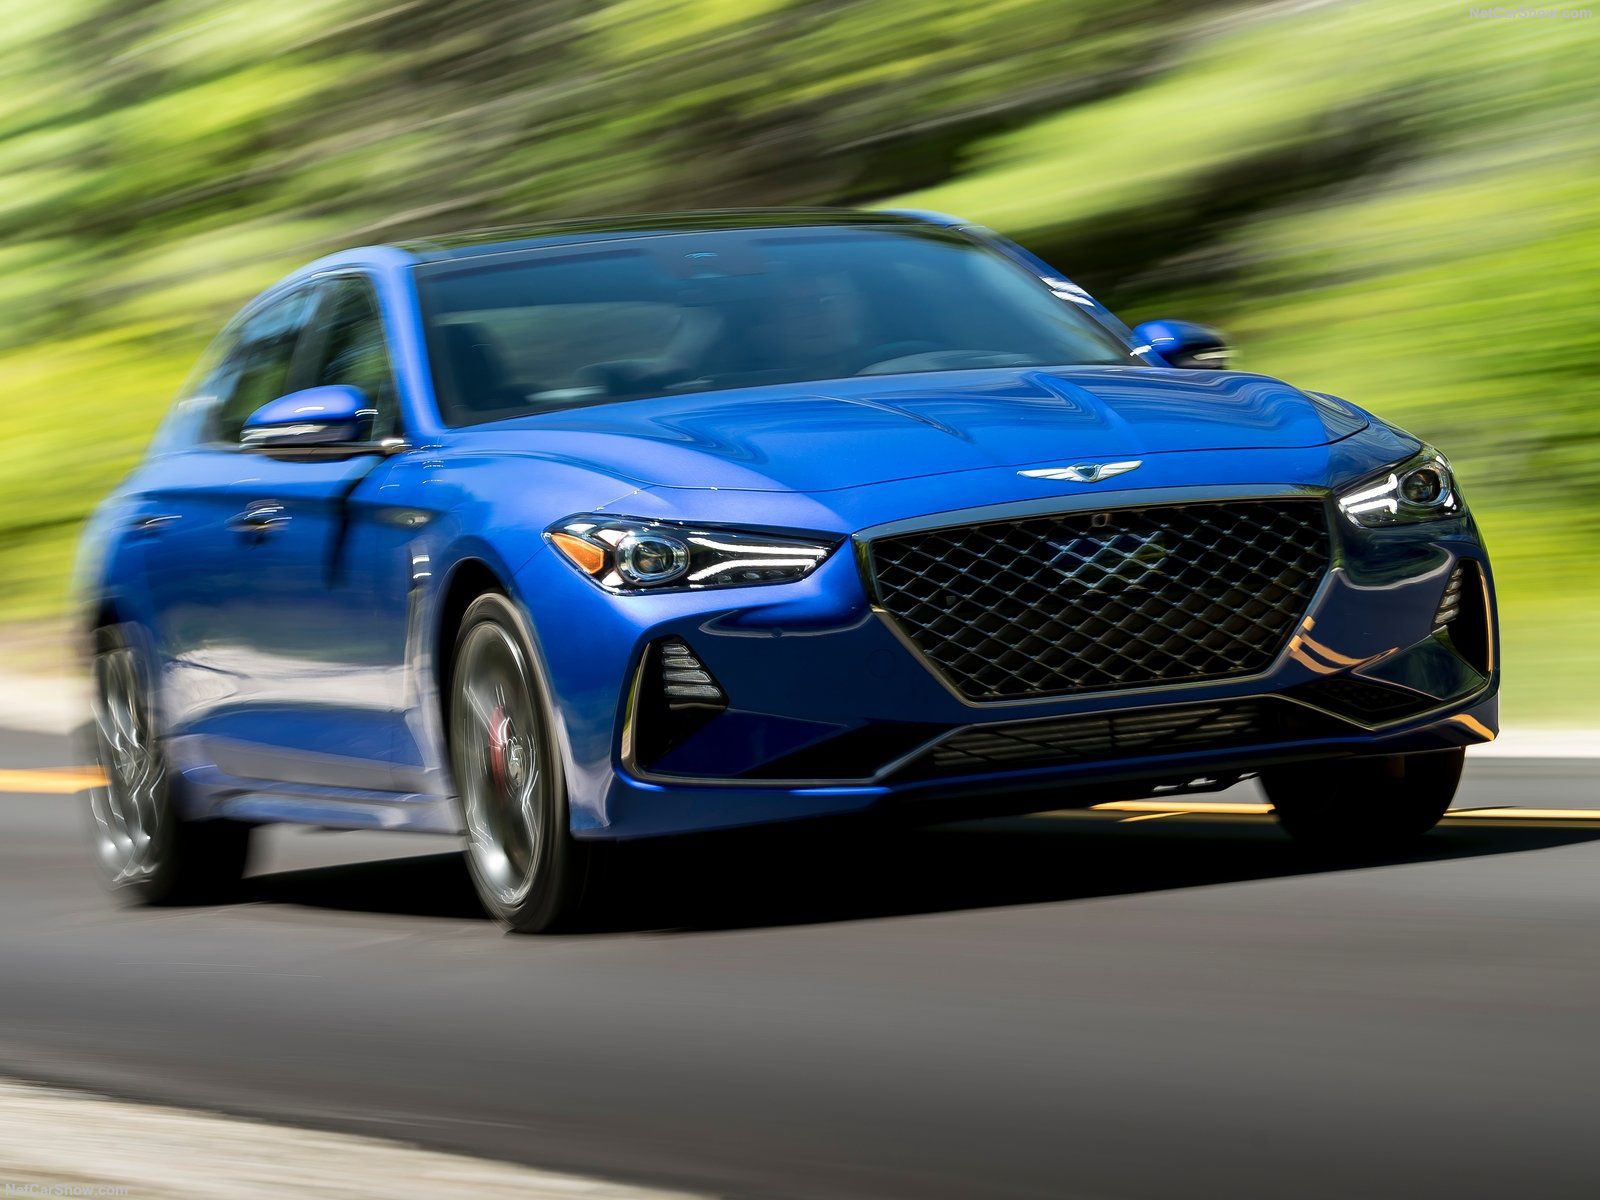
Korean Vehicles Market in 2018 registered a marginal improvement – up 1.3% from last year – ending with 1.806.609. Importers improved their mix at 14.6% thanks to the re-start of Volkswagen operations while General Motors has lost 29%.
Economic Environment
South Korean economic growth decelerated significantly in the third quarter compared to the second quarter, although this was partly due to a high base effect. The slowdown in Q3 was most evident in fixed investment. In terms of the fourth and final quarter of 2018, the economy has shown mixed signs so far. In December, the Bank of Korea’s business confidence survey posted the most pessimistic reading since January 2017, boding poorly for fixed investment.
Turning to next year, higher government spending should support economic activity. Moreover, although monetary policy will be tighter, it will remain accommodative by historical standards. However, significant global trade tensions, an economic slowdown in China and elevated domestic household debt threaten the outlook.
Market Trend
On 26 March 2017, the U.S. and Korea agreed to revise their bilateral free trade agreement. The agreement—which would improve U.S. access to Korea’s automobile market and require Korea to curb its steel exports to the U.S. in return for an exemption from higher U.S. steel tariffs
South Korean vehicles market has been closed to foreign vehicles import until the recent (2012) FTA with EU. The entrance of many new competitors fueled the market growth in these years and the all time record sales had been established in three years in a row, with 2016 above 1.8 million units. In the 2017 the market was penalized by a slow start of the year and the second half recovery was not enough to break a new record again, with light vehicles sales ended at 1.814.399 units (-1.1%), the third best performance ever.
According to data released by KAMA and KAIDA, in the 2018 the South Korean Car Passenger’s market is stable. Indeed, the year ended with 1.806.609 units sold, improving 1.3% from last year. Thus, the market is back on track after the marginal fall registered in 2017.
| Sales 2014 | Sales 2015 | Sales 2016 | Sales 2017 | Sales 2018 | '+/- 2018 |
|---|---|---|---|---|---|
| 1.613.323 | 1.824.288 | 1.834.784 | 1.784.037 | 1.806.609 | 1,3% |
Competitive Arena
Brand-wise, Hyundai is the 2018 market leader having 659.743 units (-0.8%). Kia is following with 531.700 (+1.9%).
In third place SsangYong with 109.140 units (+2.3%) followed by GM Korea (Chevrolet in the table) with 93.317 (-29.5%), Renault Samsung with 90.369 (-10.1%), Mercedes with 70.798 (+2.8%), Genesis with 61.335 (+158.8%) and BMW with 50.824 (-14.8%).
At model-wise, the 2018 best-selling car is the Hyundai Grandeur, for the second consecutive time, with 113.101 sales (-14.4%) followed by the Hyundai Santa Fe with 107.202 (+107.5%) and the Hyundai Porter with 97.995 (-3.4%).
The list of top 100 models in this and recent years is in the dedicated section.
Research, Consulting, Data & Forecast
F2M covers intensively this market with several products developed to help any investigation required. Market Researches in PDF are immediately available for download with study on the market since 2005 and with forecast up to the 2025. AutoData in EXCEL are immediately downloadable with annual sales volume, split by month, for all brands and all models distributed in the market. This year data are released year to date, but you will receive a monthly update until the year-end. See details within South Korea Corner Store.
| Rank 2018 | Rank 2017 | Sales 2018 | Sales 2017 | '+/- 2018 | |
|---|---|---|---|---|---|
| 1 | 1 | Hyundai | 659.743 | 665.245 | -0,8% |
| 2 | 2 | Kia | 531.700 | 521.550 | 1,9% |
| 3 | 4 | SsangYong | 109.140 | 106.677 | 2,3% |
| 4 | 3 | Chevrolet | 93.317 | 132.377 | -29,5% |
| 5 | 5 | Renault Samsung | 90.369 | 100.536 | -10,1% |
| 6 | 6 | Mercedes | 70.798 | 68.861 | 2,8% |
| 7 | 8 | Genesis | 61.335 | 23.704 | 158,8% |
| 8 | 7 | BMW | 50.824 | 59.624 | -14,8% |
| 9 | 10 | Toyota | 16.774 | 11.698 | 43,4% |
| 10 | 29 | Volkswagen | 15.390 | - | |
| 11 | 9 | Lexus | 13.340 | 12.603 | 5,8% |
| 12 | 25 | Audi | 12.450 | 962 | 1194,2% |
| 13 | 12 | Land Rover | 11.772 | 10.740 | 9,6% |
| 14 | 11 | Ford | 11.586 | 11.586 | 0,0% |
| 15 | 14 | Mini | 9.191 | 9.562 | -3,9% |
| 16 | 16 | Volvo | 8.524 | 6.604 | 29,1% |
| 17 | 13 | Honda | 7.956 | 10.299 | -22,7% |
| 18 | 29 | Jeep | 7.590 | - | |
| 19 | 17 | Nissan | 5.053 | 6.285 | -19,6% |
| 20 | 19 | Peugeot | 4.478 | 3.697 | 21,1% |
| Rank 2018 | Rank 2017 | Sales 2018 | Sales 2017 | '+/- 2018 | Share 2018 | |
|---|---|---|---|---|---|---|
| 1 | 1 | Hyundai-Kia | 1.252.778 | 1.210.499 | 3,5% | 69,3% |
| 2 | 4 | Mahindra Group | 109.140 | 106.677 | 2,3% | 6,0% |
| 3 | 3 | Renault Nissan Alliance | 97.552 | 109.518 | -10,9% | 5,4% |
| 4 | 2 | General Motors | 95.418 | 134.385 | -29,0% | 5,3% |
| 5 | 6 | Mercedes Daimler | 70.798 | 68.861 | 2,8% | 3,9% |
| 6 | 5 | BMW | 60.138 | 69.273 | -13,2% | 3,3% |
| 7 | 14 | Volkswagen Group | 32.351 | 4.034 | 702,0% | 1,8% |
| 8 | 7 | Toyota Group | 30.114 | 24.301 | 23,9% | 1,7% |
| 9 | 8 | Tata | 15.473 | 14.865 | 4,1% | 0,9% |
| 10 | 9 | Ford Group | 11.586 | 11.586 | 0,0% | 0,6% |
| Rank 2018 | Rank 2017 | Model | Sales 2018 | Sales 2017 | '+/- 2018 |
|---|---|---|---|---|---|
| 1 | 1 | Hyundai Grandeur | 113.101 | 132.080 | -14,4% |
| 2 | 10 | Hyundai Santa fe | 107.202 | 51.661 | 107,5% |
| 3 | 2 | Hyundai Porter | 97.995 | 101.423 | -3,4% |
| 4 | 7 | Kia Carnival | 76.362 | 68.386 | 11,7% |
| 5 | 3 | Hyundai Avante | 75.831 | 83.861 | -9,6% |
| 6 | 5 | Kia Sorento | 67.200 | 78.458 | -14,3% |
| 7 | 4 | Hyundai Sonata | 65.846 | 82.703 | -20,4% |
| 8 | 8 | Kia Bongo | 59.254 | 62.184 | -4,7% |
| 9 | 6 | Kia Morning | 59.042 | 70.437 | -16,2% |
| 10 | 26 | Hyundai Kona | 50.468 | 23.522 | 114,6% |
| 11 | 14 | Hyundai Grand Starex | 50.180 | 45.776 | 9,6% |
| 12 | 18 | Kia K5 | 48.503 | 38.184 | 27,0% |
| 13 | 22 | Kia K3 | 44.514 | 28.165 | 58,0% |
| 14 | 9 | Ssangyong Tivoli | 43.897 | 55.280 | -20,6% |
| 15 | 13 | Hyundai Tucson | 42.623 | 46.416 | -8,2% |
| 16 | 27 | SsangYong Korando Sports | 42.021 | 22.912 | 83,4% |
| 17 | 12 | Kia K7 | 40.978 | 46.578 | -12,0% |
| 18 | 11 | Chevrolet Spark | 39.868 | 47.244 | -15,6% |
| 19 | 21 | Mercedes E Class | 38.568 | 32.414 | 19,0% |
| 20 | 15 | Kia Sportage | 37.403 | 42.232 | -11,4% |
| 21 | 16 | Genesis G80 | 37.219 | 39.762 | -6,4% |
| 22 | 24 | BMW 5 Series | 35.003 | 24.119 | 45,1% |
| 23 | 23 | Samsung QM6 | 32.999 | 27.837 | 18,5% |
| 24 | 19 | Hyundai H-1 Truck | 31.237 | 35.368 | -11,7% |
| 25 | 28 | Kia Ray | 27.021 | 20.521 | 31,7% |
| 26 | 17 | Samsung SM6 | 24.800 | 39.389 | -37,0% |
| 27 | 25 | Kia Niro | 22.811 | 23.647 | -3,5% |
| 28 | 20 | Chevrolet Malibu | 17.052 | 33.325 | -48,8% |
| 29 | 30 | SsangYong G4 Rexton | 16.674 | 16.381 | 1,8% |
| 30 | 39 | Kia Stonic | 16.305 | 9.133 | 78,5% |


