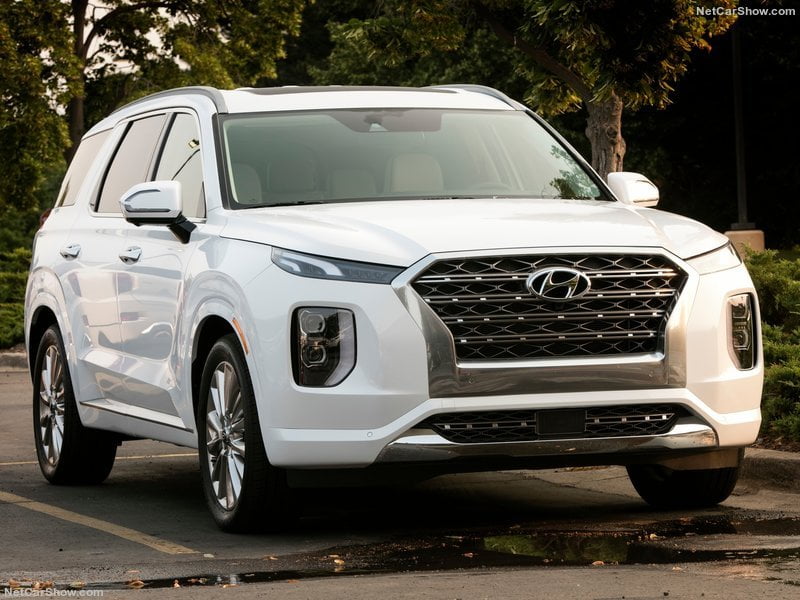
Korean Vehicles Market was marginally declining in 2019 while remaining not far from the best level ever. Indeed, the Full-year ended with 1.77 million sales, down 1.9% from the previous year. Hyundai and Kia still dominated, while their combined market share at 67.3% fell down over 7 points from 2012.
Economic Environment
South Korean economic growth was stable in the third quarter, according to revised GDP data. Private and government consumption growth remained robust, despite weakening slightly, while fixed investment declined at a softer pace and growth in exports of goods and services accelerated.
Shifting focus to the fourth quarter, the economy appears more or less on an even keel: Consumer confidence hit a seven-month high in November, while the service sector held up fairly well in October, boding well for household spending.
Meanwhile, in other news, Korea and Indonesia agreed to a free-trade deal in late November, which is expected to be ratified next year. The deal plans to eliminate tariffs on steel and automobiles, which should benefit Korean manufacturers and provide some relief to the external sector.
Market Trend
South Korean vehicles market has been closed to foreign vehicles import until the recent (2012) FTA with EU. The entrance of many new competitors fueled the market growth in these years and the all time record sales had been established in three years in a row in the period 2014-2016, with the record fixed at 1.83 million units.
On 26 March 2017, the U.S. and Korea agreed to revise their bilateral free trade agreement. The agreement—which would improve U.S. access to Korea’s automobile market and require Korea to curb its steel exports to the U.S. in return for an exemption from higher U.S. steel tariffs. The industry continued to assist at the growth of imported vehicles, mainly luxury brands, while in the 2017 and was stable around the 1.8 million units.
In 2019, according to data released by KAMA and KAIDA, the South Korean Car Passenger’s market was marginally negative. Indeed, the Full-year ended with 1.77 million sales, down 1.9% from the previous year.
The market was dominated by Hyundai and Kia, despite in recent years they are losing share. Indeed, from a record 75% of combined share in the 2012, actually they have 67.3%, over 7 points lost. Total domestic brands have been actually just over 80% of market share, down 9 points of share since 2012.
The top imported brands were Mercedes, holding over 4% of market share from 0.1% in 2011, BMW, at 2.5% and Lexus at 0.7%.
Service Solutions
Since 2010, focus2move.com is a specialist in the automotive industry tracking monthly sales for all brands and models in the widest in the World range of countries, actually over 150. From this huge database we can extract data sorted under your own conditions and deliver historical data in excel.
If you like to receive historical data or to subscribe at monthly update, contact us at kventura@focus2move.com and we will arrange a short video call. By showing you our database and segmentation, we can find together the best solutions for your team.
| Rank 2019 | Rank 2018 | Brand | Sales 2019 | Sales December | +/- YTD | Share 2019 | Share December |
|---|---|---|---|---|---|---|---|
| 1 | 1 | Hyundai | 675.402 | 64.732 | 2,4% | 38,12% | 36,31% |
| 2 | 2 | Kia | 516.171 | 45.843 | -2,9% | 29,14% | 25,71% |
| 3 | 3 | SsangYong | 107.949 | 8.432 | -1,1% | 6,09% | 4,73% |
| 4 | 5 | Renault Samsung | 86.755 | 9.876 | -4,0% | 4,90% | 5,54% |
| 5 | 6 | Mercedes | 78.036 | 8.324 | 10,2% | 4,40% | 4,67% |
| 6 | 4 | Chevrolet | 76.520 | 5.618 | -18,0% | 4,32% | 3,15% |
| 7 | 7 | Genesis | 56.696 | 4.600 | -7,6% | 3,20% | 2,58% |
| 8 | 8 | BMW | 44.191 | 5.130 | -13,1% | 2,49% | 2,88% |
| 9 | 11 | Lexus | 12.241 | 840 | -8,2% | 0,69% | 0,47% |
| 10 | 12 | Audi | 11.930 | 2.302 | -4,2% | 0,67% | 1,29% |
| 11 | 18 | Jeep | 10.706 | 1.092 | 41,1% | 0,60% | 0,61% |
| 12 | 9 | Toyota | 10.611 | 1.323 | -36,7% | 0,60% | 0,74% |
| 13 | 16 | Volvo | 10.570 | 765 | 24,0% | 0,60% | 0,43% |
| 14 | 30 | Chrysler | 10.251 | 10.251 | 0,58% | 5,75% | |
| 15 | 15 | Mini | 10.222 | 1.274 | 11,2% | 0,58% | 0,71% |
| 16 | 17 | Honda | 8.760 | 1.045 | 10,1% | 0,49% | 0,59% |
| 17 | 14 | Ford | 8.737 | 1.228 | -24,6% | 0,49% | 0,69% |
| 18 | 10 | Volkswagen | 8.510 | 2.804 | -44,7% | 0,48% | 1,57% |
| 19 | 13 | Land Rover | 7.713 | 982 | -34,5% | 0,44% | 0,55% |
| 20 | 21 | Porsche | 4.204 | 390 | -1,9% | 0,24% | 0,22% |
| 21 | 20 | Peugeot | 3.505 | 297 | -21,7% | 0,20% | 0,17% |
| 22 | 19 | Nissan | 3.049 | 324 | -39,7% | 0,17% | 0,18% |
| 23 | 22 | Jaguar | 2.484 | 201 | -32,9% | 0,14% | 0,11% |
| 24 | 23 | Infiniti | 2.000 | 138 | -6,1% | 0,11% | 0,08% |
| 25 | 24 | Cadillac | 1.714 | 172 | -18,4% | 0,10% | 0,10% |
| 26 | 25 | Maserati | 1.260 | 147 | -24,1% | 0,07% | 0,08% |
| 27 | 26 | Citroen | 962 | 126 | -8,6% | 0,05% | 0,07% |
| 28 | 29 | Lamborghini | 173 | 18 | 1472,7% | 0,01% | 0,01% |
| 29 | 28 | Rolls-Royce | 161 | 11 | 30,9% | 0,01% | 0,01% |
| 30 | 27 | Bentley | 129 | 11 | -40,0% | 0,01% | 0,01% |
| Rank 2019 | Rank 2018 | Group | Sales 2019 | Sales December | +/- 2019 | Share 2019 | Share December |
|---|---|---|---|---|---|---|---|
| 1 | 1 | Hyundai-Kia | 1.248.269 | 115175 | -0,4% | 70,61% | 64,60% |
| 2 | 2 | Mahindra Group | 107.949 | 8432 | -1,1% | 6,11% | 4,73% |
| 3 | 3 | Renault Nissan Alliance | 91.804 | 10338 | -5,9% | 5,19% | 5,80% |
| 4 | 4 | General Motors | 78.234 | 5790 | -18,0% | 4,43% | 3,25% |
| 5 | 5 | Mercedes Daimler | 78.036 | 8324 | 10,2% | 4,41% | 4,67% |
| 6 | 6 | BMW | 54.574 | 6415 | -9,3% | 3,09% | 3,60% |
| 7 | 7 | Volkswagen Group | 24.946 | 5525 | -22,9% | 1,41% | 3,10% |
| 8 | 8 | Toyota Group | 22.852 | 2163 | -24,1% | 1,29% | 1,21% |
| 9 | 11 | F.C.A. | 22.217 | 11490 | 140,2% | 1,26% | 6,44% |
| 10 | 12 | Geely Group | 10.570 | 765 | 24,0% | 0,60% | 0,43% |


