Latvia Vehicles Market 2016 gained ground in double digit, fueled by the robust increase performed in the first half of the year. Toyota was the leader despite the feeble growth.
Market Outlook
Latvia’s economy bounced back in the final quarter of 2016 after plummeting to a multi-year low in the previous quarter due in large part to EU funding delays. However, over 2016 as a whole growth has disappointed, with the slow absorption of EU funds buffeting the economy of one of the largest net beneficiaries of the EU budget. FocusEconomics analysts surveyed this month expect GDP to increase 2.8% in 2017.
Meantime, the automotive market in 2016 recorded a strong increase in double digit, posting the best performance since 2010. Pushed up by the robust performance in the first half of the year, the total vehicles sold had been 18.729, improving 16.2%.
According to data released by the Auto Asociacjia, the Association of Car Manufacturers in Latvia, in December the vehicles passengers had been 1.399, up 11.7%.
Competitive Arena
(Data reported here include LCVs)
Volkswagen confirmed the leadership with 2.576 units (+0.2%) ahead of Toyota and Nissan respectively up 9.0% and 0.7% at 2.004 and 1.505. The best performers of the year were Jaguar and Bentley, surging 185.7% and 112.5%, while among the sharpest increases were recorded by Opel, Mazda, Peugeot, Kia and Ford.
Alfa Romeo and Suzuki posted the worst performances, losing 51.7% and 36.7%, followed by BMW, Fiat and Land Rover.
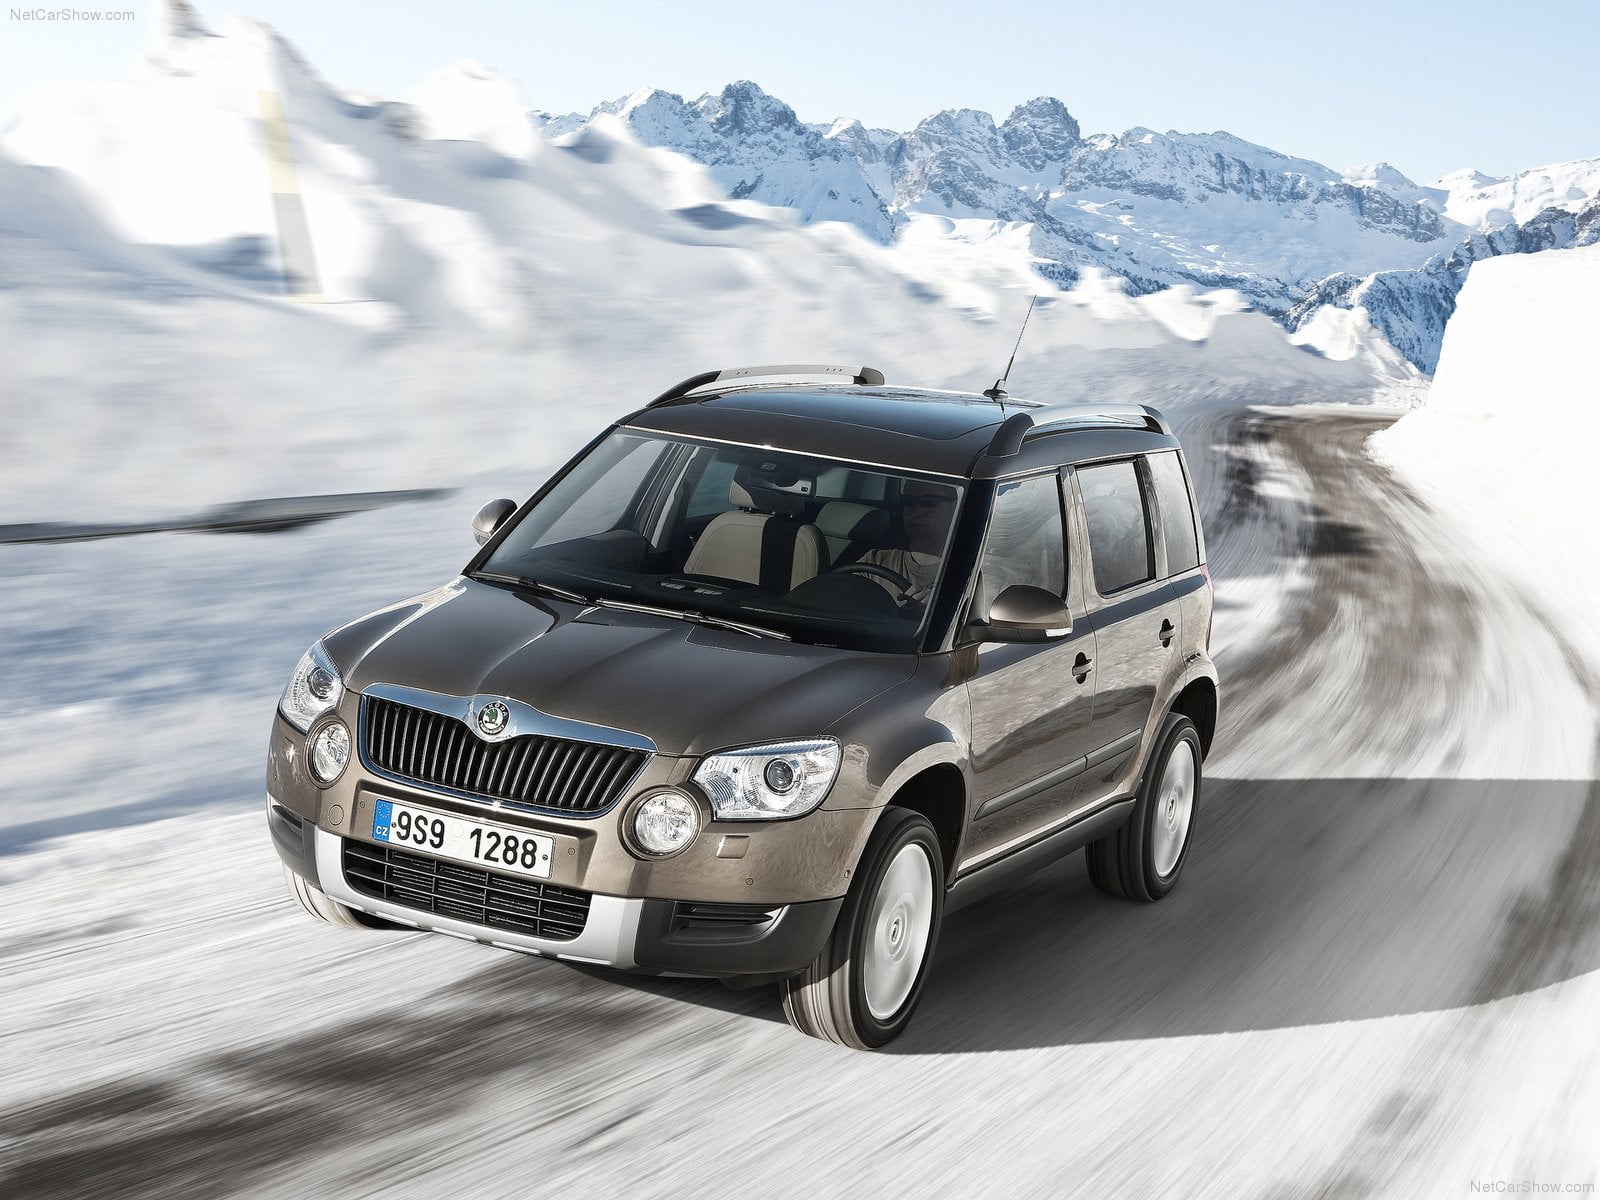
The Nissan Qashqai was the best selling model with 773 sales (-10.7%) ahead of the Skoda Octavia with 587 (+33.7%) and the Skoda Yeti with 575 (+19.5).
Below, you can sort our interactive tables to see data regarding Brands, Groups and Models. Please bear in mind that sales data are subject to adjustments as sources will update their information. This report is updated at the publishing date and will not be modified while the next on this subject will report year to date data updated.
| Rank Dec | Rank 2016 | BRAND | Sales December | Sales 2016 FY | Variation December | Variation 2016 FY | Share December | Share 2016 |
|---|---|---|---|---|---|---|---|---|
| 1 | 1 | Volkswagen | 210 | 2.576 | 1,4% | 0,2% | 14,3% | 13,9% |
| 2 | 2 | Toyota | 164 | 2.004 | 10,8% | 9,0% | 11,2% | 10,8% |
| 5 | 3 | Nissan | 110 | 1.505 | -9,8% | 0,7% | 7,5% | 8,1% |
| 3 | 4 | Skoda | 138 | 1.386 | 64,3% | 16,2% | 9,4% | 7,5% |
| 4 | 5 | Ford | 117 | 1.287 | 36,0% | 39,6% | 8,0% | 6,9% |
| 7 | 6 | Opel | 77 | 1.100 | 60,4% | 87,7% | 5,2% | 5,9% |
| 6 | 7 | Peugeot | 80 | 988 | 40,4% | 64,7% | 5,4% | 5,3% |
| 8 | 8 | Renault | 62 | 986 | -28,7% | 13,9% | 4,2% | 5,3% |
| 9 | 9 | Kia | 60 | 774 | 9,1% | 40,7% | 4,1% | 4,2% |
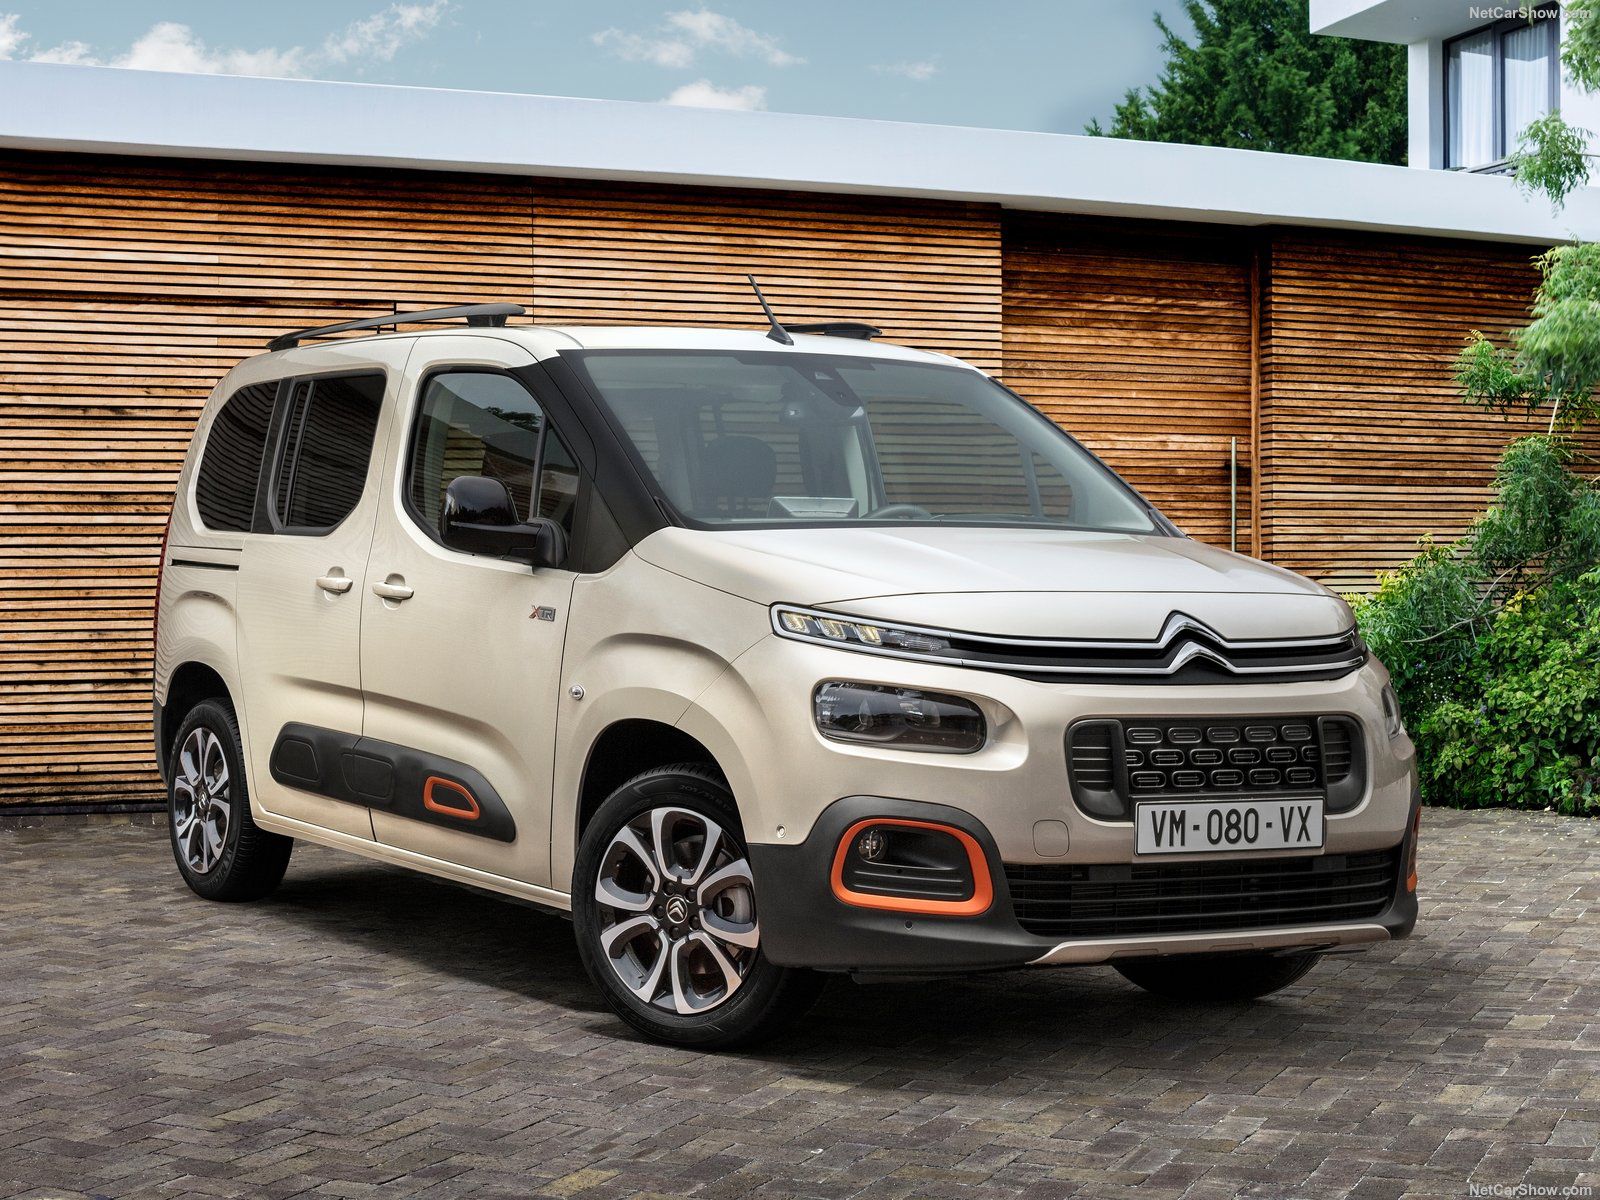
| 9 | 10 | Citroen | 60 | 756 | -10,4% | 32,9% | 4,1% | 4,1% |
| 19 | 11 | Fiat | 18 | 637 | -78,3% | -10,9% | 1,2% | 3,4% |
| 10 | 12 | Hyundai | 55 | 575 | 19,6% | 34,7% | 3,7% | 3,1% |
| 12 | 13 | BMW | 32 | 425 | -5,9% | -16,6% | 2,2% | 2,3% |
| 11 | 14 | Mercedes | 38 | 414 | 35,7% | 18,3% | 2,6% | 2,2% |
| 12 | 15 | Audi | 32 | 384 | 28,0% | 26,3% | 2,2% | 2,1% |
| 13 | 16 | Dacia | 30 | 346 | 50,0% | 6,5% | 2,0% | 1,9% |
| 16 | 17 | Lada | 21 | 325 | -22,2% | -2,7% | 1,4% | 1,8% |
| 14 | 18 | Subaru | 24 | 299 | 20,0% | -2,9% | 1,6% | 1,6% |
| 17 | 19 | Volvo | 20 | 250 | 33,3% | 31,6% | 1,4% | 1,3% |
| 15 | 20 | Mitsubishi | 22 | 242 | 10,0% | 29,4% | 1,5% | 1,3% |
| 20 | 21 | Honda | 13 | 227 | -48,0% | -4,6% | 0,9% | 1,2% |
| 18 | 22 | Mazda | 19 | 211 | 35,7% | 75,8% | 1,3% | 1,1% |
| 16 | 23 | Lexus | 21 | 201 | 5,0% | 19,6% | 1,4% | 1,1% |
| 21 | 24 | Land Rover | 10 | 190 | 11,1% | -6,9% | 0,7% | 1,0% |
| 23 | 25 | Suzuki | 5 | 95 | -72,2% | -36,7% | 0,3% | 0,5% |
| 22 | 26 | Jeep | 8 | 85 | -20,0% | -34,1% | 0,5% | 0,5% |
| 23 | 27 | Porsche | 5 | 66 | -16,7% | -2,9% | 0,3% | 0,4% |
| 23 | 28 | Mini | 5 | 58 | 0,0% | 52,6% | 0,3% | 0,3% |
| 24 | 29 | Jaguar | 4 | 40 | 300,0% | 185,7% | 0,3% | 0,2% |
| 24 | 30 | Seat | 4 | 35 | 100,0% | 84,2% | 0,3% | 0,2% |
| 24 | 31 | Bentley | 4 | 34 | 300,0% | 112,5% | 0,3% | 0,2% |
| Rank Dec | Rank 2016 | GROUP | Sales December | Sales 2016 FY | Variation December | Variation 2016 FY | Share December | Share 2016 FY |
|---|---|---|---|---|---|---|---|---|
| 1 | 1 | Volkswagen | 393 | 4.481 | 20,9% | 7,4% | 26,8% | 24,1% |
| 2 | 2 | Renault-Nissan | 223 | 3.166 | -12,9% | 4,8% | 15,2% | 17,1% |
| 3 | 3 | Toyota | 185 | 2.205 | 10,1% | 9,9% | 12,6% | 11,9% |
| 4 | 4 | PSA | 140 | 1.744 | 12,9% | 49,2% | 9,5% | 9,4% |
| 6 | 5 | Hyundai-Kia | 115 | 1.349 | 13,9% | 38,1% | 7,8% | 7,3% |
| 5 | 6 | Ford | 117 | 1.287 | 36,0% | 39,6% | 8,0% | 6,9% |
| 7 | 7 | General Motors | 77 | 1.106 | 60,4% | 87,5% | 5,2% | 6,0% |
| 10 | 8 | FCA | 27 | 762 | -73,0% | -18,0% | 1,8% | 4,1% |
| 9 | 9 | BMW | 37 | 484 | -5,1% | -11,6% | 2,5% | 2,6% |
| 8 | 10 | Mercedes Daimler | 38 | 414 | 35,7% | 18,3% | 2,6% | 2,2% |
| Rank Dec | Rank 2016 | Model | Sales December | Sales 2016 | Variation December | Variation 2016 |
|---|---|---|---|---|---|---|
| 2 | 1 | Nissan Qashqai | 60 | 773 | -16,9% | -10,7% |
| 2 | 2 | Skoda Octavia | 60 | 587 | 64,0% | 33,7% |
| 1 | 3 | Skoda Yeti | 62 | 575 | 54,7% | 19,5% |
| 3 | 4 | Volkswagen Golf | 48 | 574 | 29,4% | 29,0% |
| 4 | 5 | Volkswagen Passat | 39 | 472 | -19,0% | -18,3% |
| 5 | 6 | Toyota RAV4 | 36 | 441 | 9,1% | 11,4% |
| 6 | 7 | Kia Sportage | 34 | 407 | 30,4% | 30,0% |
| 22 | 7 | Opel Mokka | 16 | 407 | 20,0% | 154,4% |
| 8 | 8 | Volkswagen Tiguan | 32 | 381 | 48,3% | 47,1% |
| 10 | 9 | Citroen Berlingo | 29 | 379 | 34,9% | 46,9% |
| 9 | 10 | Ford Focus | 30 | 360 | 2,6% | 2,6% |
| 16 | 10 | Toyota Auris | 23 | 360 | -14,3% | 11,8% |
| 7 | 11 | Ford Fiesta | 33 | 357 | 308,2% | 268,0% |
| 13 | 12 | Toyota Avensis | 26 | 331 | 19,1% | 26,3% |
| 12 | 13 | Volkswagen Caddy | 27 | 330 | -5,0% | -3,2% |
| 30 | 14 | Fiat 500 | 8 | 328 | -75,5% | -16,3% |
| 16 | 15 | Peugeot 308 | 23 | 322 | 711,8% | 847,1% |
| 19 | 16 | Lada 4×4 | 19 | 295 | -31,1% | -10,9% |
| 17 | 17 | Nissan X-Trail | 22 | 291 | 131,6% | 155,3% |
| 23 | 18 | Renault Trafic | 15 | 282 | -3,7% | 50,8% |
| 21 | 19 | Kia Ceed | 17 | 272 | 41,7% | 88,9% |
| 22 | 20 | Toyota Corolla | 16 | 220 | -21,3% | -9,8% |
| 14 | 21 | Peugeot Partner | 25 | 214 | 98,7% | 41,7% |
| 15 | 22 | Hyundai i20 | 24 | 213 | 234,9% | 147,7% |
| 21 | 23 | Dacia Duster | 17 | 208 | 20,0% | 22,4% |
| 20 | 24 | Renault Master | 18 | 198 | 9,1% | 0,0% |
| 18 | 25 | Toyota Hilux | 20 | 194 | 38,7% | 12,1% |
| 21 | 26 | Opel Astra | 17 | 193 | 96,2% | 85,6% |
| 22 | 26 | Volkswagen Jetta | 16 | 193 | -21,6% | -21,2% |
| 21 | 27 | Toyota Yaris | 17 | 188 | 32,5% | 22,1% |
| 25 | 28 | Nissan Juke | 13 | 169 | -29,4% | -23,5% |
| 11 | 29 | Subaru Legacy | 28 | 166 | ||
| 34 | 30 | Fiat 500x | 4 | 165 | 220,0% | 1000,0% |
| 27 | 31 | Citroen C4 | 11 | 155 | 43,5% | 68,5% |
| 26 | 32 | Hyundai i30 | 12 | 151 | 17,1% | 22,8% |
| 30 | 33 | Peugeot 2008 | 8 | 150 | 17,1% | 82,9% |
| 26 | 34 | Volkswagen Polo | 12 | 148 | 32,1% | 35,8% |
| 30 | 35 | Nissan Pulsar | 8 | 147 | -50,5% | -24,2% |
| 26 | 36 | Audi Q5 | 12 | 144 | 92,0% | 92,0% |
| 24 | 37 | Hyundai ix35/Tucson | 14 | 141 | 71,4% | 43,9% |
| 26 | 38 | Ford C-max | 12 | 133 | 144,1% | 125,4% |
| 36 | 39 | Renault Scénic | 2 | 128 | -80,3% | 4,9% |
| 32 | 39 | Opel Insignia | 6 | 128 | 50,0% | 166,7% |
| 25 | 40 | Opel Corsa | 13 | 122 | 35,7% | 6,1% |


