Latvia Vehicles Industry in 2015 at the best out of last 6 years. Nissan boomed gaining the top place among models with the Qashqai. The Russian Lada penetrated the market with outstanding sales report.
Economic Outlook
Preliminary data showed that, despite a moderation in the final quarter of 2015, the economy remained solid in the year as a whole. Latvia’s GDP increased 3.0% annually in Q4, which came in below the 3.3% expansion registered in Q3. In 2015, the economy grew 2.7%, which marked an improvement over the 2.4% expansion observed in 2014.
On the political front, on 12 January, President Raimonds Vejonis nominated Maris Kucinskis—an experienced politician and lawmaker from the Union of Greens and Farmers—to form the next government after Laimdota Straujuma announced her resignation in early December amid falling popularity.
Kucinskis is expected to form his cabinet soon and the next government is likely to continue implementing the same economic policies as its predecessor.
Market Outlook
According to data released by the Auto Asociacjia, the Association of Car Manufacturers in Latvia, during the entire 2015 the total new Car Passengers sold have been 13.765, up 10.5% from the 2014, posting the best score in the last sixth years.
Market leader was Volkswagen with 2.571 sales (+1.6%) and 16.0% of market share with a solid gap over the second, Toyota, which sold 1.839 vehicles (+0.3%) and a new guest for the podium, Nissan, jumped up 57.6% at 1.498 units and gaining two spots.
Behind Skoda with 1.193 (-7.0%) and a strong Ford with 922(+78.3%).
To be underlined the rapid development of Lada with 334 units sold from near zero in the 2014.
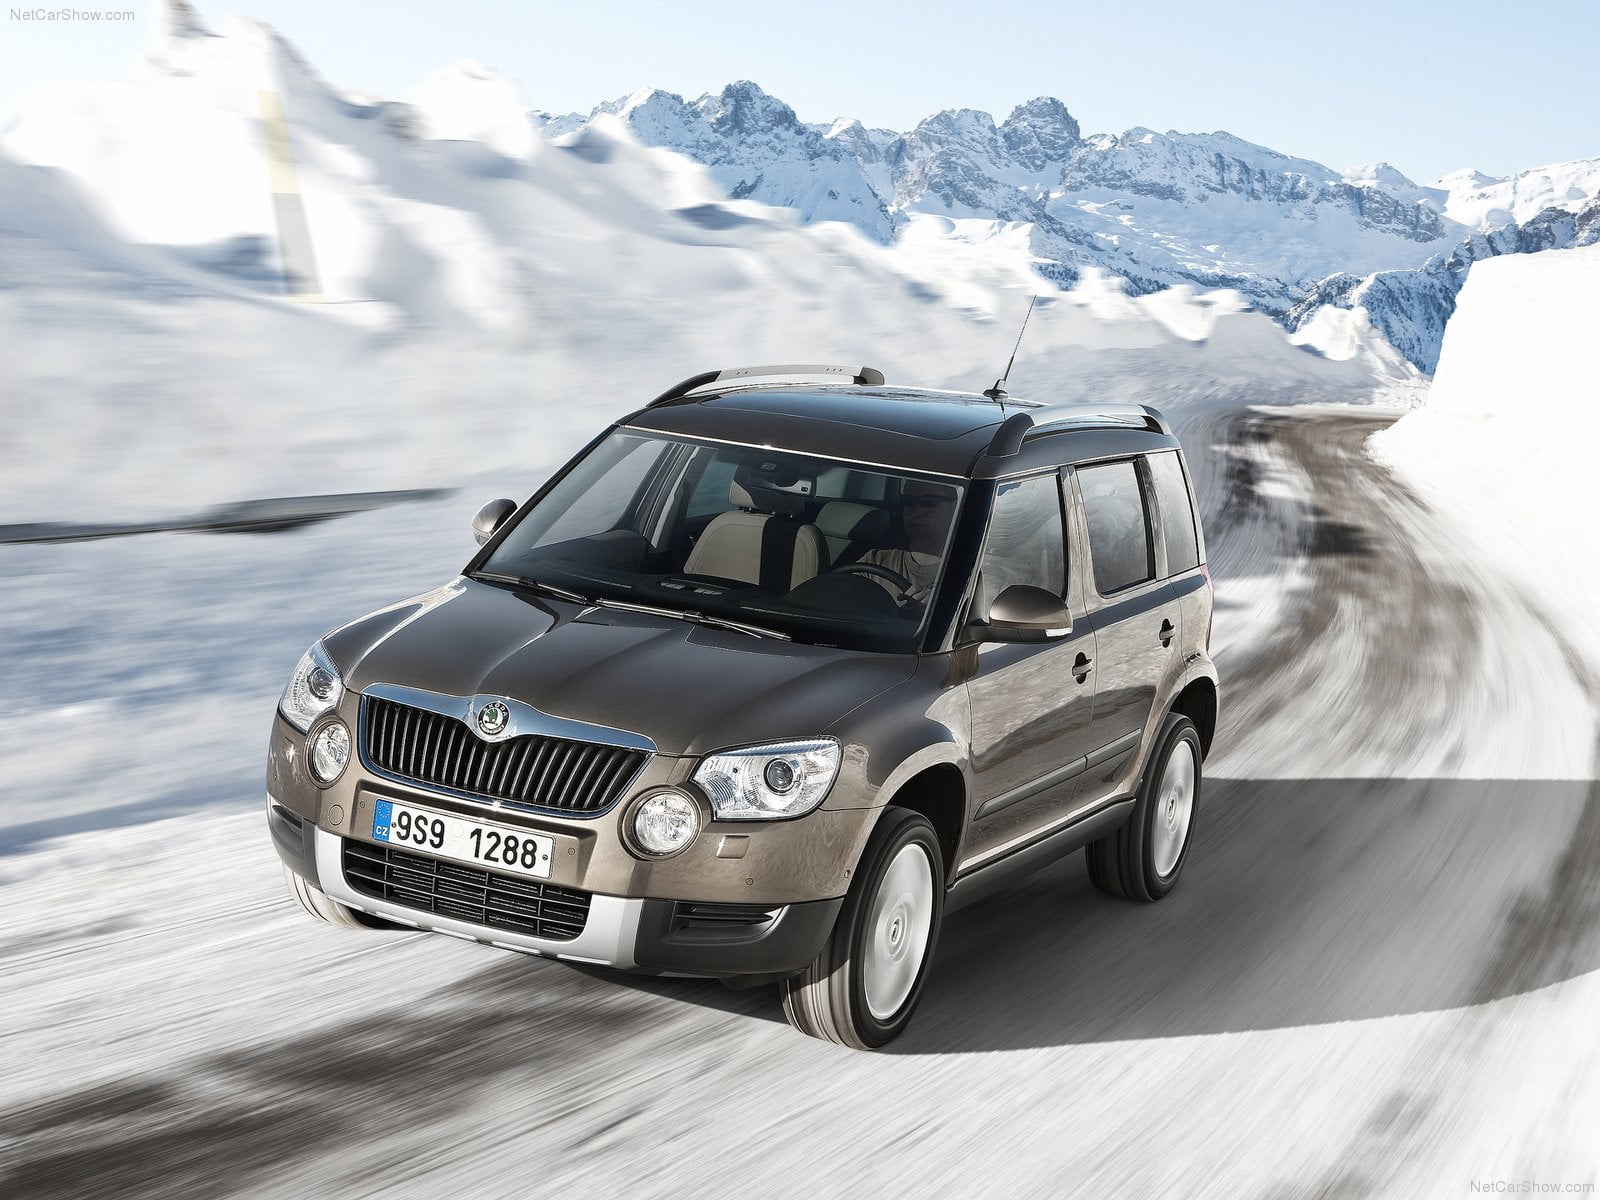
Nissan Qashqai won the race as best model with 866 sales (+62.2%) outpacing the Volkswagen Passat with 578 and the Skoda Yeti, leader in the 2014, with 481.
Below, you can sort our interactive tables to see data regarding Brands, Groups and Models. Please bear in mind that sales data are subject to adjustments as sources will update their information. This report is updated at the publishing date and will not be modified while the next on this subject will report year to date data updated.
| Rank 2015 | Rank 2014 | Brand | 2015 | 2014 | 2015 Var | Share 2015 |
|---|---|---|---|---|---|---|
| 1 | 1 | Volkswagen | 2.571 | 2.531 | 1,6% | 16,0% |
| 2 | 2 | Toyota | 1.839 | 1.833 | 0,3% | 11,4% |
| 3 | 5 | Nissan | 1.494 | 948 | 57,6% | 9,3% |
| 4 | 3 | Skoda | 1.193 | 1.283 | -7,0% | 7,4% |
| 5 | 8 | Ford | 922 | 517 | 78,3% | 5,7% |
| 6 | 6 | Renault | 866 | 930 | -6,9% | 5,4% |
| 7 | 14 | Fiat | 715 | 389 | 83,8% | 4,4% |
| 8 | 4 | Peugeot | 600 | 1.011 | -40,7% | 3,7% |
| 9 | 7 | Opel | 586 | 550 | 6,5% | 3,6% |
| 10 | 9 | Citroen | 569 | 484 | 17,6% | 3,5% |
| 11 | 11 | Kia | 550 | 475 | 15,8% | 3,4% |
| 12 | 12 | BMW | 510 | 409 | 24,6% | 3,2% |
| 13 | 13 | Hyundai | 427 | 408 | 4,7% | 2,7% |
| 14 | 16 | Mercedes | 350 | 340 | 2,9% | 2,2% |
| 15 | 31 | Lada | 334 | 11 | 2936,4% | 2,1% |
| 16 | 10 | Dacia | 325 | 482 | -32,6% | 2,0% |
| 17 | 19 | Subaru | 308 | 227 | 35,7% | 1,9% |
| 18 | 15 | Audi | 304 | 376 | -19,1% | 1,9% |
| 19 | 17 | Honda | 238 | 309 | -23,0% | 1,5% |
| 20 | 23 | Land Rover | 204 | 153 | 33,3% | 1,3% |
| 21 | 18 | Volvo | 190 | 237 | -19,8% | 1,2% |
| 22 | 20 | Mitsubishi | 187 | 216 | -13,4% | 1,2% |
| 23 | 21 | Lexus | 168 | 194 | -13,4% | 1,0% |
| 24 | 22 | Suzuki | 150 | 181 | -17,1% | 0,9% |
| 25 | 24 | Jeep | 129 | 131 | -1,5% | 0,8% |
| 26 | 25 | Mazda | 120 | 115 | 4,3% | 0,7% |
| 27 | 26 | Porsche | 68 | 71 | -4,2% | 0,4% |
| 28 | 35 | Alfa Romeo | 60 | 4 | 1400,0% | 0,4% |
| 29 | 27 | Mini | 38 | 46 | -17,4% | 0,2% |
| 30 | 29 | Seat | 19 | 25 | -24,0% | 0,1% |
| 31 | 30 | Bentley | 16 | 16 | 0,0% | 0,1% |
| 32 | 34 | Jaguar | 14 | 5 | 180,0% | 0,1% |
| 33 | 32 | Lancia | 12 | 10 | 20,0% | 0,1% |
| 34 | 36 | Iveco | 7 | 3 | 133,3% | 0,0% |
| 34 | 36 | Tesla | 7 | 3 | 133,3% | 0,0% |
| 35 | 33 | Dodge | 4 | 8 | -49,1% | 0,0% |
| 36 | 38 | Cadillac | 4 | 1 | 300,0% | 0,0% |
| 37 | 36 | Infiniti | 3 | 3 | 2,3% | 0,0% |
| 38 | 36 | Maserati | 2 | 3 | -33,3% | 0,0% |
| 39 | 37 | Aston Martin | 1 | 2 | -50,0% | 0,0% |
| Rank 2015 | Rank 2014 | Model | Sales 2015 | Sale 2014 | 2015 Var | Share 2015 | Share 2014 |
|---|---|---|---|---|---|---|---|
| 1 | 2 | Nissan Qashqai | 866 | 534 | 62,2% | 5,4% | 3,6% |
| 2 | 5 | Volkswagen Passat | 578 | 368 | 57,1% | 3,6% | 2,5% |
| 3 | 1 | Skoda Yeti | 481 | 619 | -22,3% | 3,0% | 4,2% |
| 4 | 3 | Volkswagen Golf | 445 | 471 | -5,5% | 2,8% | 3,2% |
| 5 | 6 | Skoda Octavia | 439 | 363 | 20,9% | 2,8% | 2,4% |
| 6 | 4 | Toyota RAV4 | 396 | 439 | -9,8% | 2,5% | 3,0% |
| 7 | 16 | Fiat 500 | 392 | 207 | 89,4% | 2,5% | 1,4% |
| 8 | 13 | Ford Focus | 351 | 219 | 60,3% | 2,2% | 1,5% |
| 9 | 8 | Volkswagen Caddy | 341 | 340 | 0,3% | 2,1% | 2,3% |
| 10 | 94 | Lada 4×4 | 331 | 10 | 3210,0% | 2,1% | 0,1% |
| 11 | 10 | Toyota Auris | 322 | 273 | 17,9% | 2,0% | 1,8% |
| 12 | 14 | Kia Sportage | 313 | 215 | 45,6% | 2,0% | 1,4% |
| 13 | 15 | Toyota Avensis | 262 | 210 | 24,8% | 1,6% | 1,4% |
| 14 | 26 | Volkswagen Tiguan | 259 | 163 | 58,9% | 1,6% | 1,1% |
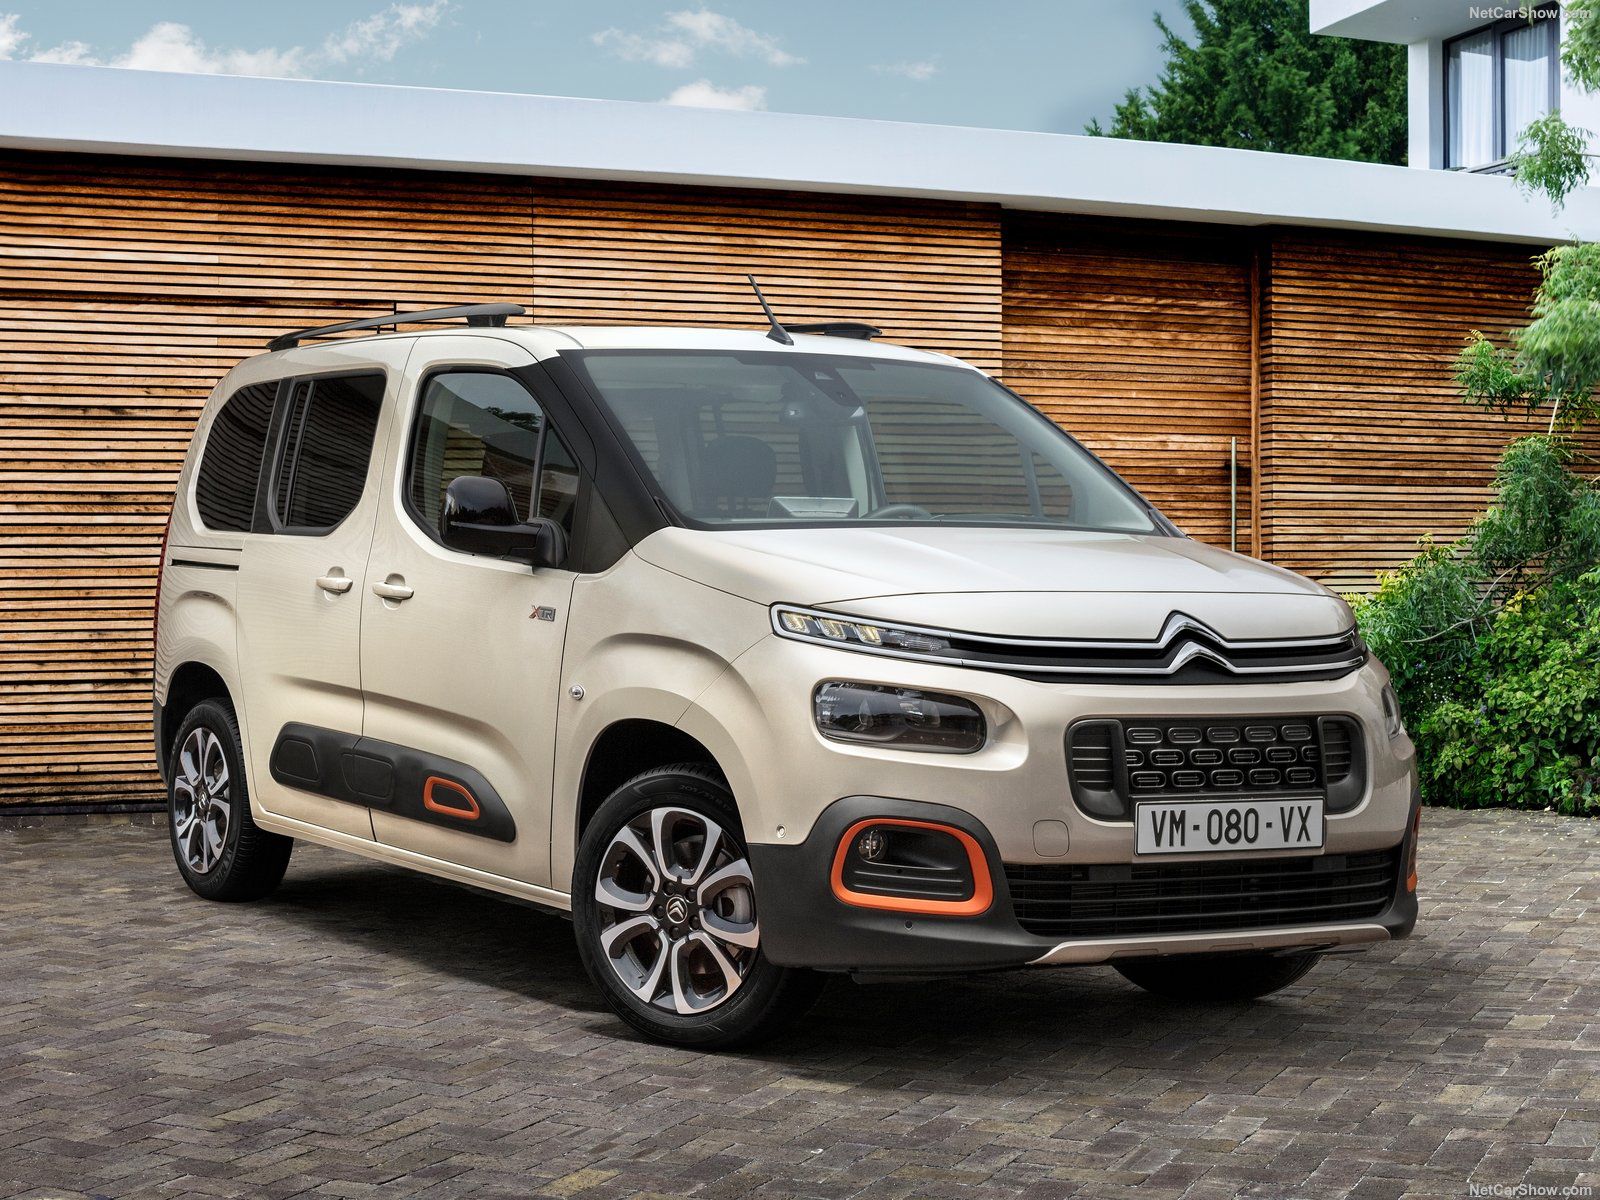
| 15 | 20 | Citroen Berlingo | 258 | 186 | 38,7% | 1,6% | 1,3% |
| 16 | 12 | Volkswagen Jetta | 245 | 251 | -2,4% | 1,5% | 1,7% |
| 17 | 18 | Toyota Corolla | 244 | 203 | 20,2% | 1,5% | 1,4% |
| 18 | 21 | Nissan Juke | 221 | 185 | 19,5% | 1,4% | 1,2% |
| 19 | 11 | Renault Master | 198 | 272 | -27,2% | 1,2% | 1,8% |
| 20 | 97 | Nissan Pulsar | 194 | 7 | 2671,4% | 1,2% | 0,0% |
| 21 | 56 | Subaru Outback | 189 | 68 | 177,9% | 1,2% | 0,5% |
| 22 | 25 | Renault Trafic | 187 | 164 | 14,0% | 1,2% | 1,1% |
| 23 | 27 | Toyota Hilux | 173 | 159 | 8,8% | 1,1% | 1,1% |
| 24 | 7 | Dacia Duster | 170 | 345 | -50,7% | 1,1% | 2,3% |
| 25 | 31 | Volkswagen Crafter | 164 | 137 | 19,7% | 1,0% | 0,9% |


