Lithuania Auto Market is 2015 reported a solid +17%, the best out of last sixth years. Fiat confirmed the leadership ahead of Volkswagen and Toyota. Therefore the market stands at the half of the record level.
Country Outlook
Preliminary figures released by the Lithuanian Statistical Institute showed that GDP grew 2.0% in annual terms in Q4, which marked an acceleration from the 1.7% increase tallied in Q3.
The data suggests that the Lithuanian economy bottomed out in the first half of 2015 and gained steam in the last two quarters of the 2015 thanks to greater exports to the European Union, which more than offset a stark drop in exports to Russia.
Latest data suggests that the economy bottomed out in 2015 and will expand going forward on the back of a recovery of export growth. Meanwhile, Lithuania is considering issuing EUR 500 million in Eurobonds in 2016. The government stated that the timing was still uncertain, but affirmed they will raise most of the bond issuance from domestic sources.
Market Outlook
According with data released by the Lithuanian Minister of Transportation, during the 2015 the vehicles market reported a moderately positive performance further recovering the 17.8% with total sales at 17.085 units,
Although the 2015 was the best out of last sixth years, current volume stands around the half achieved before the 2008 global financial crisis.
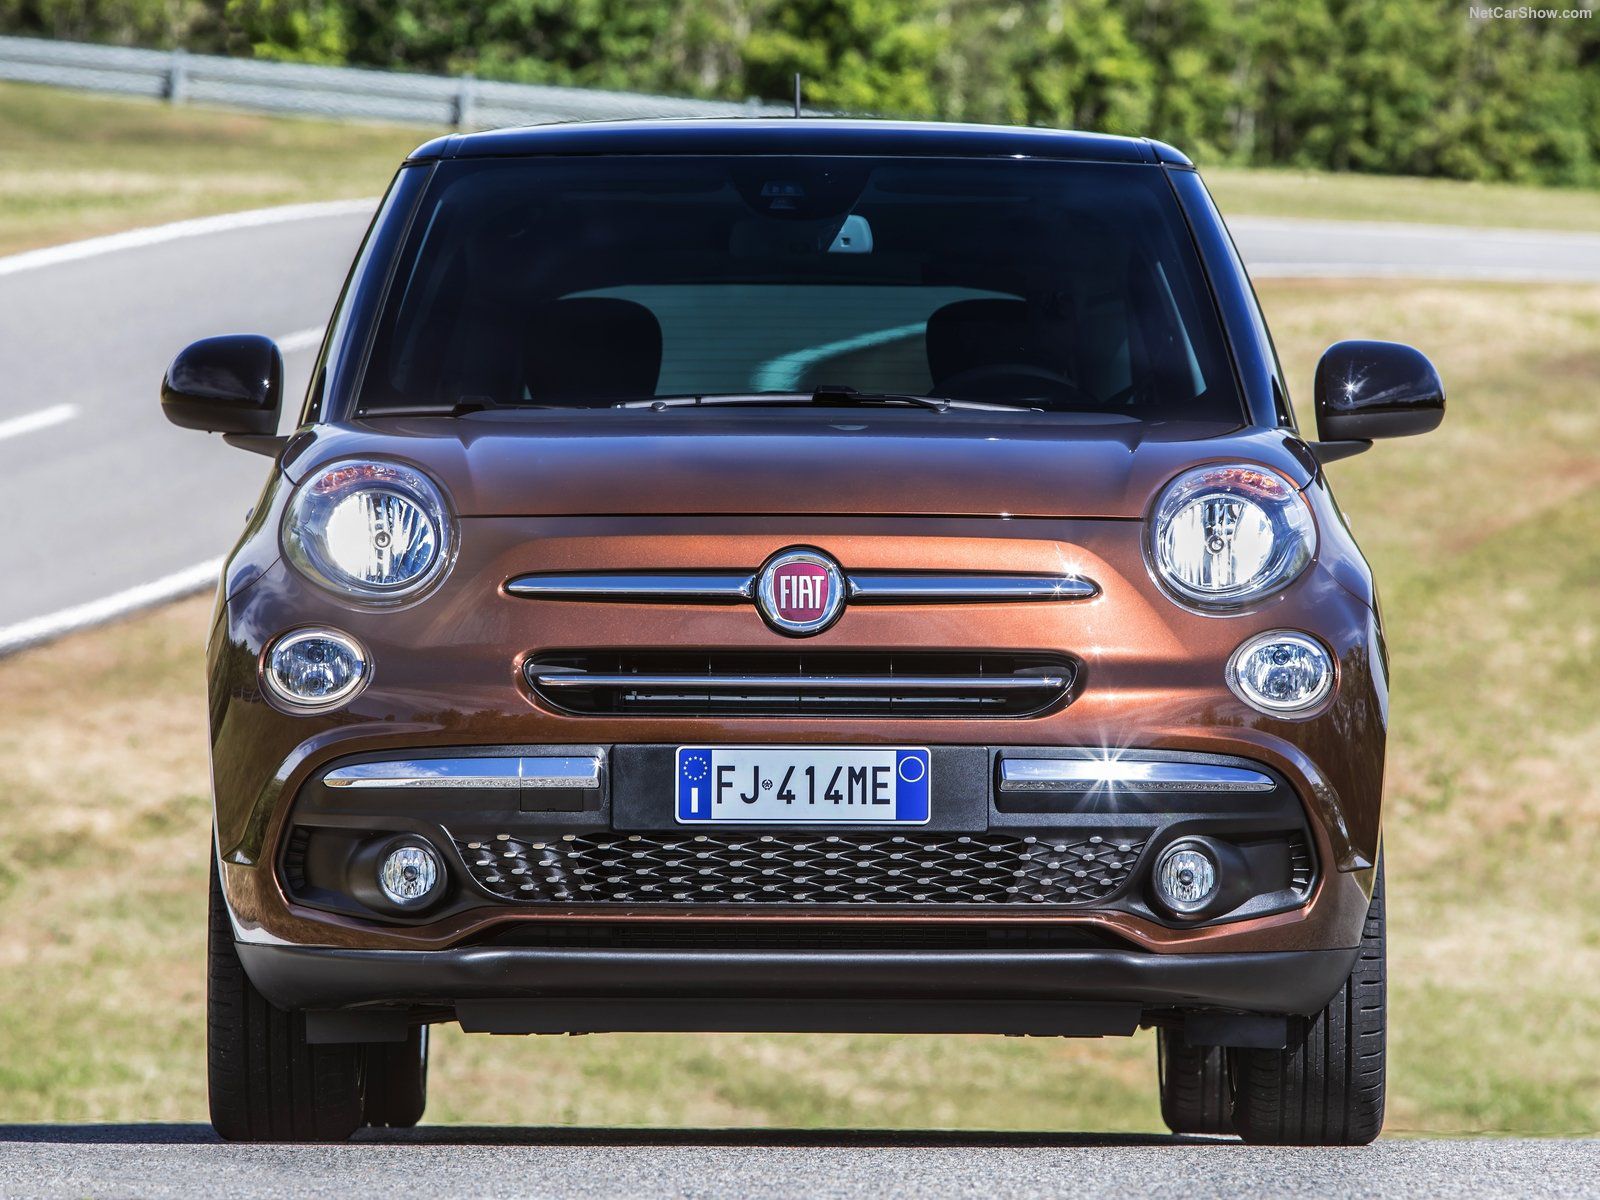
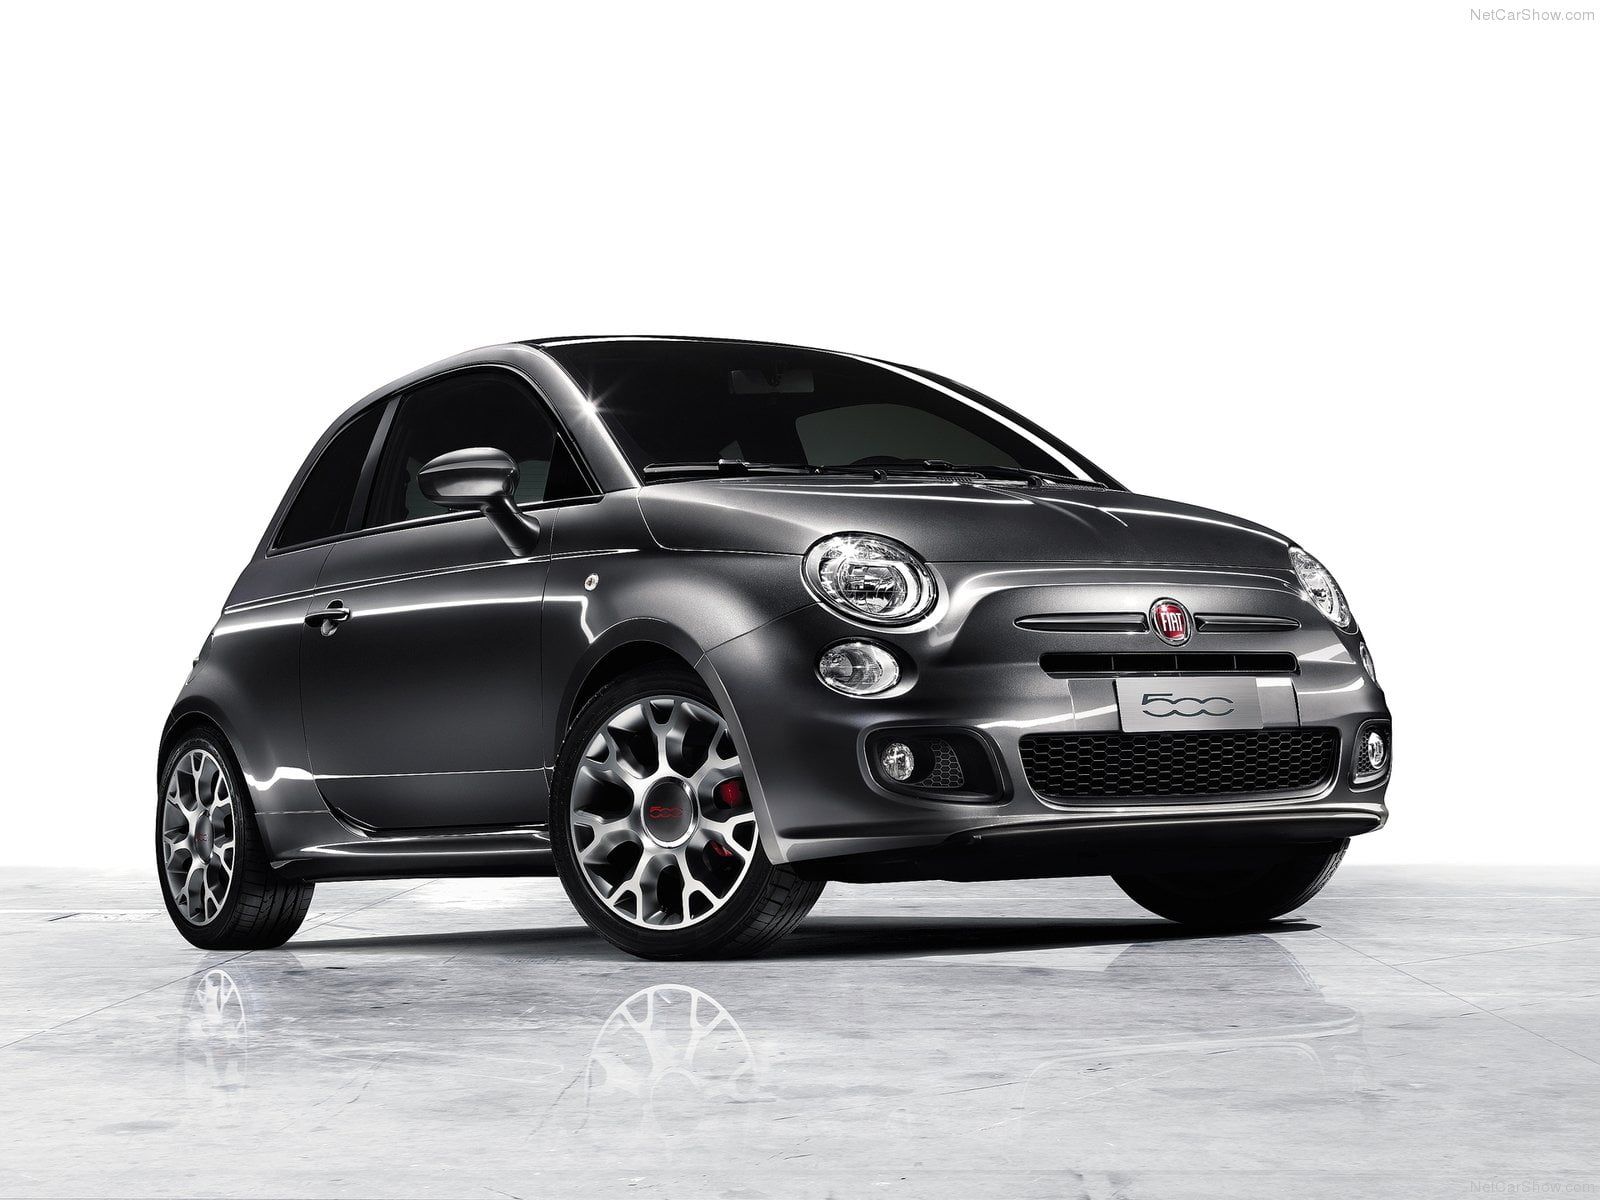
The first five places had been unchanged with Fiat again market leader with 2.711 sales (+28.8%) and 15.9% of market share, one points better than Volkswagen, second with 2.542 units (+23.4%). Third was Toyota with 1.894 (+24.3%) followed by Skoda with 1.775 (+20.3%) and Nissan with 1.392 (+21.6%).
Below, you can sort our interactive tables to see data regarding Brands, Groups and Models. Please bear in mind that sales data are subject to adjustments as sources will update their information. This report is updated at the publishing date and will not be modified while the next on this subject will report year to date data updated.
| Rank 2015 | Rank 2014 | Brand | 2015 | 2014 | 2015 Var | Share 2015 |
|---|---|---|---|---|---|---|
| 1 | 1 | Fiat | 2.711 | 2.105 | 28,8% | 15,9% |
| 2 | 2 | Volkswagen | 2.542 | 2.060 | 23,4% | 14,9% |
| 3 | 3 | Toyota | 1.894 | 1.524 | 24,3% | 11,1% |
| 4 | 4 | Skoda | 1.775 | 1.475 | 20,3% | 10,4% |
| 5 | 5 | Nissan | 1.392 | 1.145 | 21,6% | 8,2% |
| 6 | 10 | Opel | 653 | 460 | 42,0% | 3,8% |
| 7 | 6 | Kia | 638 | 581 | 9,8% | 3,7% |
| 8 | 9 | Renault | 614 | 469 | 30,9% | 3,6% |
| 9 | 7 | Ford | 580 | 576 | 0,7% | 3,4% |
| 10 | 8 | BMW | 569 | 542 | 5,0% | 3,3% |


