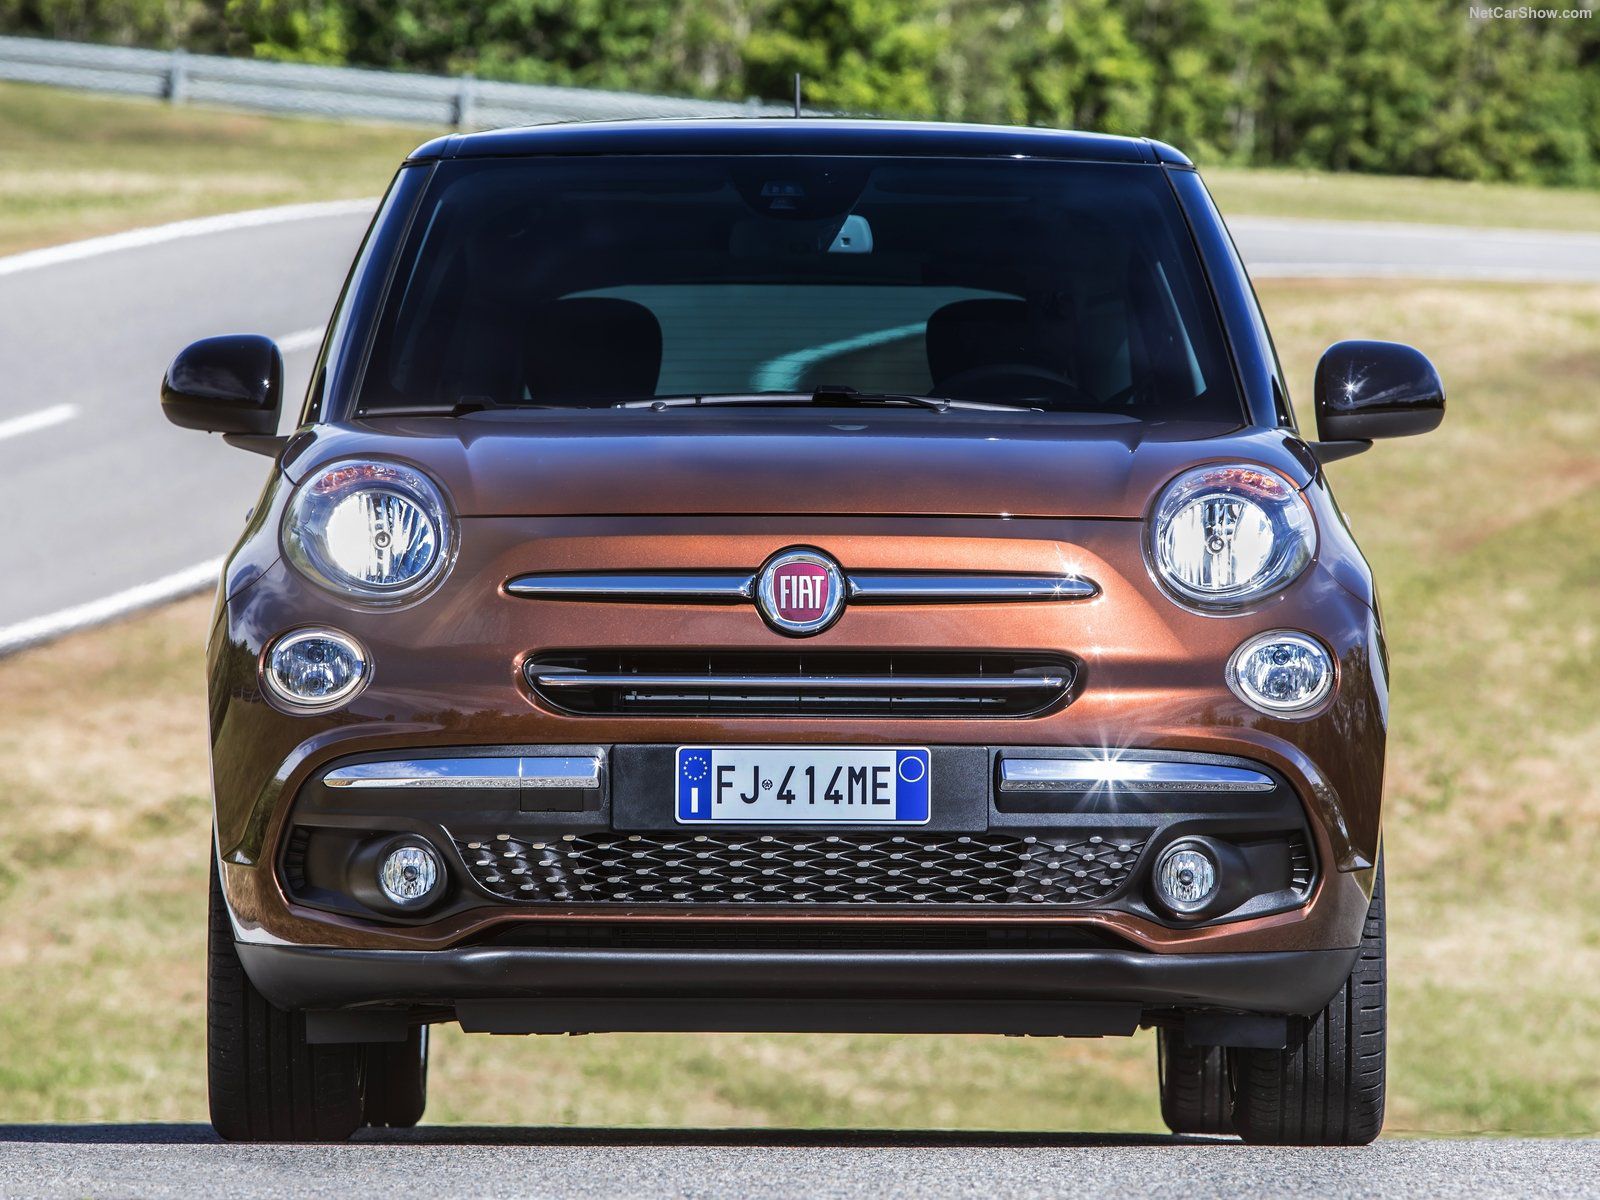
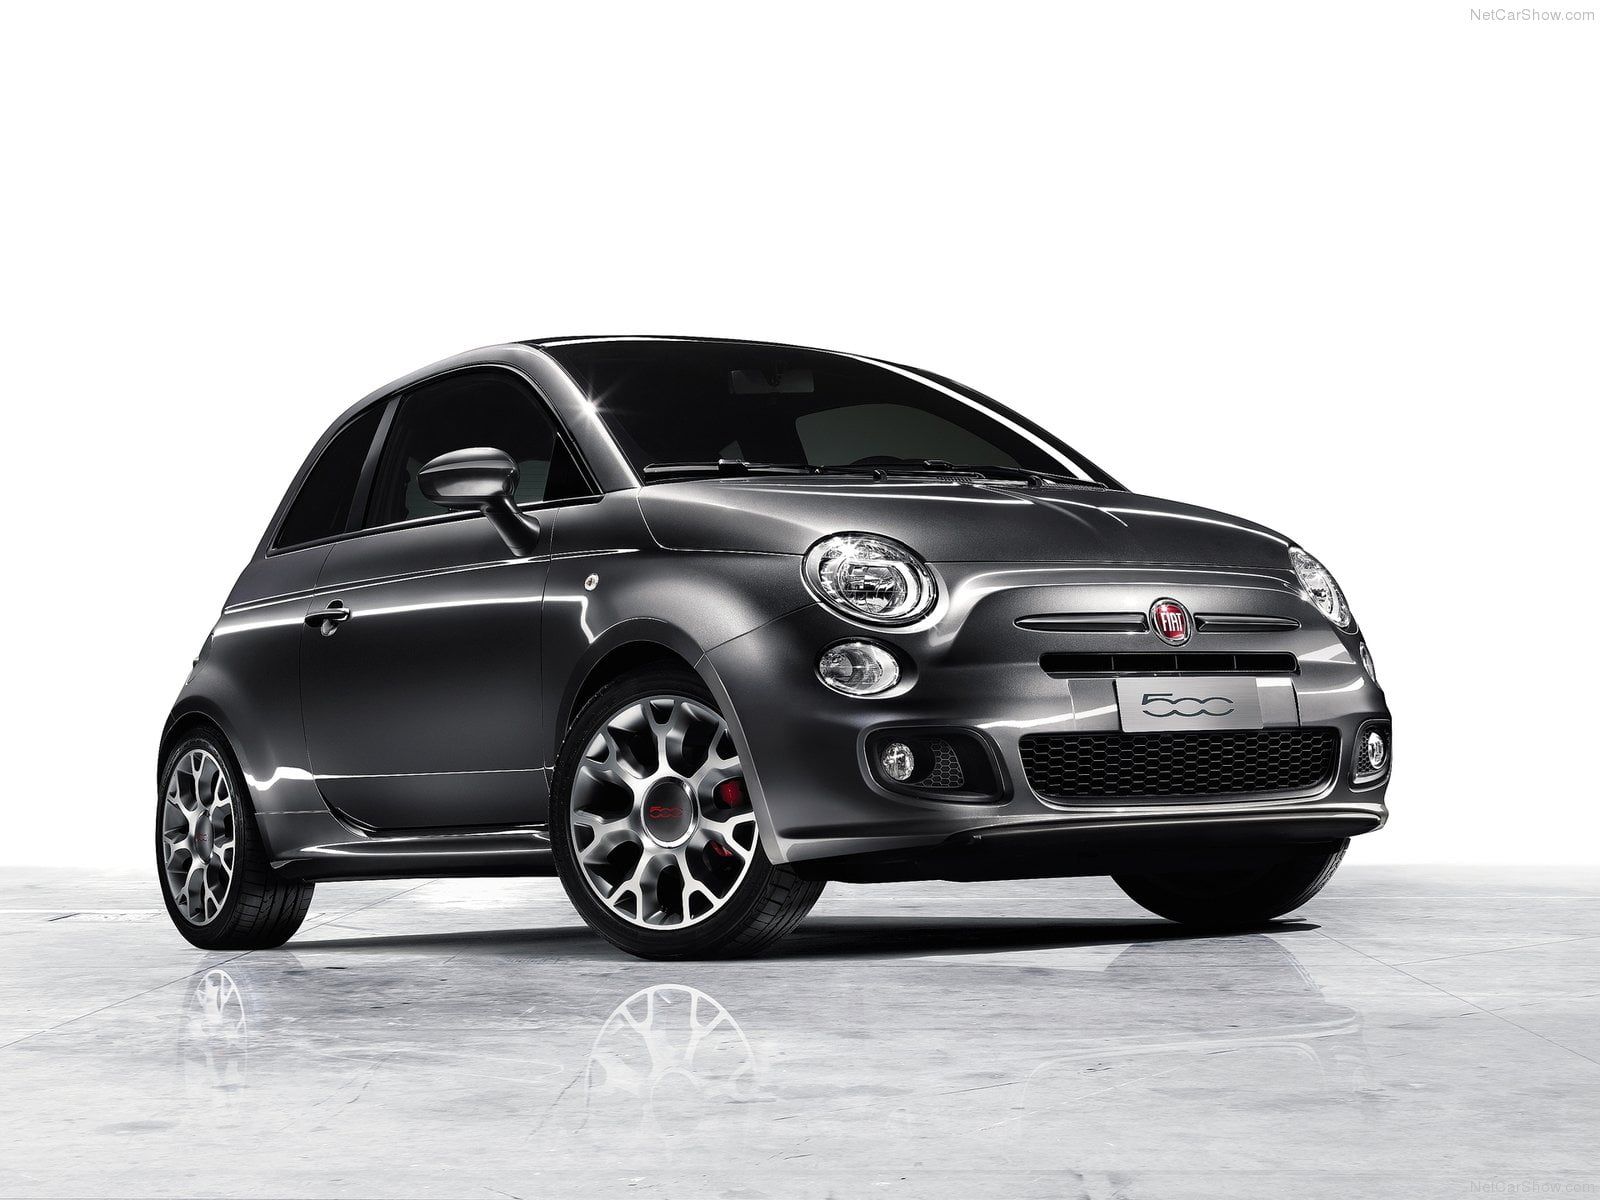
Lithuania New Cars Market in 2016 kept a robust growing speed, hitting the third annual increase in double-digit. Fiat was again in pole position, pushed up by the Fiat 500 renovated success.
Market Outlook
Lithuania shifted into higher gear in the final quarter of 2016, accelerating from Q3’s 1.7% to 3.0%. Despite the remarkable pick-up, the country continues to suffer from an exodus of skilled workers looking for better opportunities abroad. The shortage of workers is exacerbating the economic woes of Lithuania’s already beleaguered sectors, particularly agriculture and construction. FocusEconomics panelists expect the economy to expand 2.7% in 2017.
As regard the auto sector, Lithuania is one of the small Eastern European markets where the development of mass motorization is relatively recent. In 2016, the new cars market boomed in double-digit for the third consecutive year, hitting the best performance since 2009.
Instead, according to data released by the Lithuanian Minister of Transportation, new cars sales had been 20.320 (+18.9%) while light commercial vehicles sales were 2.793.
Competitive Arena
Fiat was riding high confirming the leadership with 3.370 units (+24.3%) and 17.8% of market share. Volkswagen ranked second with 2.643 sales (+4.0%) ahead of Toyota with 2.415 (+27.5%).
The best performer was Renault surging 50.6% followed by Kia, BMW and Opel, while Skoda decline moderately.
The Fiat 500 was the best-selling model with 2.459 units (+13.4%) ahead of the Nissan Qashqai with 794 (-5.0%) and the Skoda Octavia with 783 (-11.7%).
Below, you can sort our interactive tables to see data regarding Brands, Groups and Models. Please bear in mind that sales data are subject to adjustments as sources will update their information. This report is updated at the publishing date and will not be modified while the next on this subject will report year to date data updated.
| Rank 2016 | Rank 2015 | BRAND | Sales 2016 | Sales 2015 | Variation 2016 | Share 2016 | Share 2015 |
|---|---|---|---|---|---|---|---|
| 1 | 1 | Fiat | 3.370 | 2.711 | 24,30% | 17,80% | 15,90% |
| 2 | 2 | Volkswagen | 2.643 | 2.542 | 4,00% | 13,90% | 14,90% |
| 3 | 3 | Toyota | 2.415 | 1.894 | 27,50% | 12,70% | 11,10% |
| 4 | 4 | Skoda | 1.640 | 1.775 | -7,60% | 8,70% | 10,40% |
| 5 | 5 | Nissan | 1.410 | 1.392 | 1,30% | 7,40% | 8,20% |
| 6 | 8 | Renault | 925 | 614 | 50,60% | 4,90% | 3,60% |
| 7 | 7 | Kia | 828 | 638 | 29,80% | 4,40% | 3,70% |
| 8 | 6 | Opel | 747 | 653 | 14,40% | 3,90% | 3,80% |
| 9 | 10 | BMW | 662 | 569 | 16,30% | 3,50% | 3,30% |
| 10 | 9 | Ford | 620 | 580 | 6,90% | 3,30% | 3,40% |
| Rank 2016 | Rank 2015 | Group | Sales 2015 | Sales 2016 | Variation 2016 | Share 2016 | Share 2015 |
|---|---|---|---|---|---|---|---|
| 1 | 1 | Volkswagen | 4.644 | 4.610 | -0,7% | 24,3% | 27,2% |
| 2 | 2 | FCA | 2.816 | 3.475 | 23,4% | 18,3% | 16,5% |
| 3 | 3 | Renault-Nissan | 2.414 | 2.743 | 13,6% | 14,5% | 14,1% |
| 4 | 4 | Toyota | 1.992 | 2.513 | 26,2% | 13,3% | 11,7% |
| 5 | 5 | Hyundai-Kia | 1.031 | 1.221 | 18,4% | 6,4% | 6,0% |
| 6 | 6 | General Motors | 705 | 799 | 13,3% | 4,2% | 4,1% |
| 7 | 7 | BMW | 604 | 697 | 15,4% | 3,7% | 3,5% |
| 8 | 8 | Ford | 580 | 620 | 6,9% | 3,3% | 3,4% |
| 9 | 9 | PSA | 512 | 512 | 0,0% | 2,7% | 3,0% |
| 10 | 10 | Mazda | 280 | 280 | 0,0% | 1,5% | 1,6% |
| Rank 2016 | Rank 2015 | Model | Sales 2016 | Sales 2015 | 2016 Variation |
|---|---|---|---|---|---|
| 1 | 1 | Fiat 500 | 2.459 | 2.168 | 13,4% |
| 2 | 3 | Nissan Qashqai | 794 | 836 | -5,0% |
| 3 | 2 | Skoda Octavia | 783 | 887 | -11,7% |
| 4 | 4 | Volkswagen Passat | 747 | 767 | -2,6% |
| 5 | 8 | Volkswagen Golf | 601 | 275 | 118,5% |
| 6 | 6 | Toyota RAV4 | 474 | 340 | 39,4% |
| 7 | 7 | Toyota Avensis | 439 | 332 | 32,2% |
| 8 | 5 | Volkswagen Jetta | 348 | 348 | 0,0% |
| 9 | 9 | Skoda Yeti | 273 | 273 | 0,0% |
| 10 | 10 | Fiat 500L | 263 | 263 | 0,0% |
| 11 | 11 | Skoda Rapid | 261 | 261 | 0,0% |


