Malaysian Vehicles Market in 2019 has reported a stable performance. Indeed, the full-year ended with 592.666 registrations, improving just 1% from the previous year. The leader Perodua held over 40% of share, while Proton jumped in 2nd place.
Economic Environment
Malaysian economy likely lost more steam in the fourth quarter after slowing to the joint lowest reading in three years in the third. The merchandise export slump continued in November, albeit at a softer pace, on declining electronic and petroleum shipments. Meanwhile, the unemployment rate ticked up in November and private credit growth fell to an over one-decade low in October–November, boding poorly for household consumption.
Turning to the 2020, India’s recent decision to curb refined palm oil imports from Malaysia over a political rift could deal a blow to the already fragile external sector. Indian demand accounts for nearly a quarter of all palm oil exports.
Market Trend
Malaysian vehicles market grew up uninterruptedly from 2012 to 2015 hitting the all-time record with 666.745 units, before to decline in the 2016 at 583.219 and again in the 2017. In 2018 the market stared recovering, registering 598.742 units (+3.8%), pushed by the temporary removal of the 6% Goods and Services Tax (GST) on all car purchases since June.
In 2019, according to data released by the Malaysian Automotive Association, the market was stable. Indeed, the full-year ended with 592.666 registrations, improving just 1% from the previous year.
In the competitive landscape, the market leader Perodua kept improving its market share year-by-year, gaining near 10 points of share during the last decade. Indeed, the Malaysian brand ended with over 40% of market share.
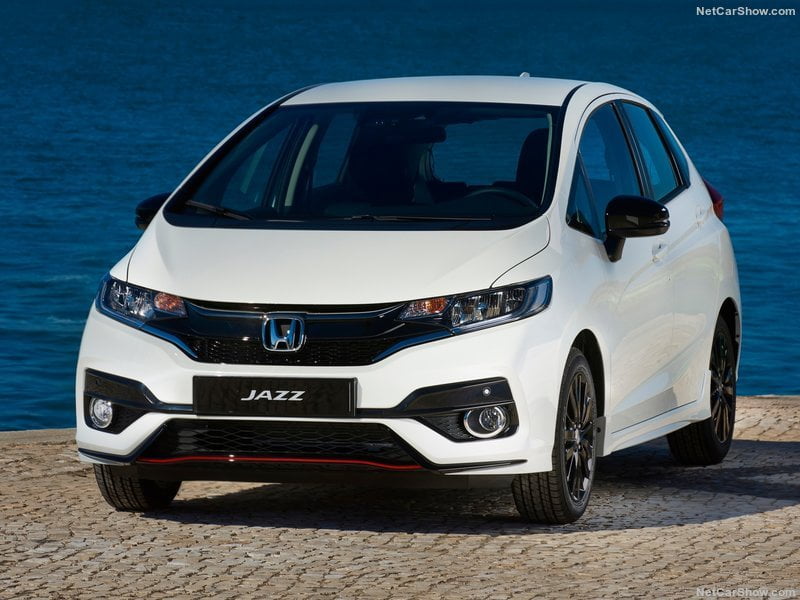
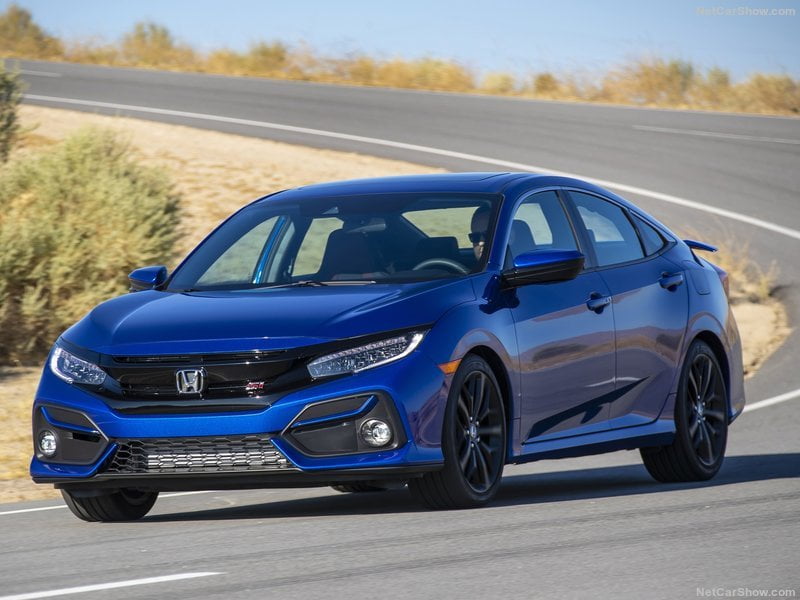
After having crumbled from 27.3% of share in 2011 to 10.8% in 2018, Proton (in second position) ended at 16.9% thanks to an astonishing performance (+54.7%). The follower, Honda, reproted a double-digit drop and closing the year with 14.4% of share.
Service Solutions
Since 2010, focus2move.com is a specialist in the automotive industry tracking monthly sales for all brands and models in the widest in the World range of countries, actually over 150. From this huge database we can extract data sorted under your own conditions and deliver historical data in excel.
If you like to receive historical data or to subscribe at monthly update, contact us at kventura@focus2move.com and we will arrange a short video call. By showing you our database and segmentation, we can find together the best solutions for your team.
| Rank 2019 | Rank 2018 | Brand | Sales 2019 | Sales December | +/- YTD | Share 2019 | Share December |
|---|---|---|---|---|---|---|---|
| 1 | 1 | Perodua | 240.341 | 18.357 | 5,8% | 40,55% | 34,17% |
| 2 | 4 | Proton | 100.183 | 11.117 | 54,7% | 16,90% | 20,69% |
| 3 | 2 | Honda | 85.418 | 7.235 | -16,5% | 14,41% | 13,47% |
| 4 | 3 | Toyota | 69.091 | 8.046 | 5,4% | 11,66% | 14,98% |
| 5 | 5 | Nissan | 21.239 | 2.124 | -25,8% | 3,58% | 3,95% |
| 6 | 6 | Mazda | 11.651 | 901 | -27,4% | 1,97% | 1,68% |
| 7 | 7 | Mercedes | 10.535 | 1.176 | -21,7% | 1,78% | 2,19% |
| 8 | 8 | BMW | 9.300 | 465 | -22,6% | 1,57% | 0,87% |
| 9 | 9 | Isuzu | 8.983 | 1.193 | -19,6% | 1,52% | 2,22% |
| 10 | 10 | Mitsubishi | 8.140 | 775 | -12,1% | 1,37% | 1,44% |
| 11 | 11 | Volkswagen | 5.559 | 598 | -20,6% | 0,94% | 1,11% |
| 12 | 12 | Hino | 5.520 | 500 | -5,0% | 0,93% | 0,93% |
| 13 | 13 | Kia | 3.432 | 233 | -39,3% | 0,58% | 0,43% |
| 14 | 14 | Subaru | 2.864 | 138 | -44,7% | 0,48% | 0,26% |
| 15 | 15 | Hyundai | 2.256 | 171 | -23,5% | 0,38% | 0,32% |
| 16 | 17 | Peugeot | 1.897 | 142 | -17,6% | 0,32% | 0,26% |
| 17 | 16 | Mitsubishi Fuso | 1.841 | 160 | -20,2% | 0,31% | 0,30% |
| 18 | 19 | Renault | 1.218 | 78 | 20,7% | 0,21% | 0,15% |
| 19 | 18 | Mini | 1.142 | 91 | -4,8% | 0,19% | 0,17% |
| 20 | 21 | Scania | 492 | 34 | -12,5% | 0,08% | 0,06% |
| 21 | 22 | Volvo Trucks | 478 | 41 | 6,9% | 0,08% | 0,08% |
| 22 | 20 | UD Trucks | 446 | 92 | -34,0% | 0,08% | 0,17% |
| 23 | 23 | Porsche | 367 | 42 | 7,3% | 0,06% | 0,08% |
| 24 | 29 | Foton | 121 | 10 | 0,02% | 0,02% | |
| 25 | 27 | JAC | 61 | 6 | 3,4% | 0,01% | 0,01% |
| 26 | 26 | King Long | 55 | 3 | -53,4% | 0,01% | 0,01% |
| 27 | 24 | Mercedes Trucks | 33 | - | -88,8% | 0,01% | 0,00% |
| 28 | 25 | Chevrolet | 3 | - | -98,7% | 0,00% | 0,00% |
| Rank 2019 | Rank 2018 | Group | Sales 2019 | Sales December | +/- 2019 | Share 2019 | Share December |
|---|---|---|---|---|---|---|---|
| 1 | 1 | Perodua | 240.341 | 18357 | 5,8% | 40,38% | 34,17% |
| 2 | 4 | Geely Group | 100.183 | 11117 | 54,7% | 16,83% | 20,69% |
| 3 | 2 | Honda Motor | 85.418 | 7235 | -16,5% | 14,35% | 13,47% |
| 4 | 3 | Toyota Group | 74.611 | 8546 | 4,6% | 12,53% | 15,91% |
| 5 | 5 | Renault Nissan Alliance | 30.597 | 2977 | -21,3% | 5,14% | 5,54% |
| 6 | 7 | Mercedes Daimler | 12.376 | 1336 | -21,5% | 2,08% | 2,49% |
| 7 | 6 | Mazda | 11.651 | 901 | -27,4% | 1,96% | 1,68% |
| 8 | 8 | BMW | 10.442 | 556 | -20,9% | 1,75% | 1,03% |
| 9 | 9 | Isuzu Motors | 8.983 | 1193 | -19,6% | 1,51% | 2,22% |
| 10 | 11 | Volkswagen Group | 6.418 | 674 | -18,8% | 1,08% | 1,25% |
| Rank 2019 | Rank 2018 | Model | Sales 2019 | 2019 Var | December Sales | December var |
|---|---|---|---|---|---|---|
| 1 | 1 | Perodua Myvi | 81966 | -0,2% | 7010 | -2,2% |
| 2 | 2 | Perodua Axia | 67267 | -5,0% | 2346 | -60,2% |
| 3 | 4 | Perodua Bezza | 45656 | -8,5% | 4200 | -50,3% |
| 4 | 9 | Proton Saga | 38144 | 90,2% | 1544 | -46,2% |
| 5 | Perodua Aruz | 30115 | 415 | |||
| 6 | 6 | Honda City | 27367 | -16,0% | 2692 | 91,5% |
| 7 | 5 | Honda HR-V | 26513 | -25,0% | 2801 | |
| 8 | 39 | Proton X70 | 26331 | 1070,3% | 1031 | 415,5% |
| 9 | 8 | Proton Persona | 21876 | 4,0% | 976 | 639,4% |
| 10 | 7 | Toyota Vios | 21322 | -5,0% | 1986 | -55,2% |


