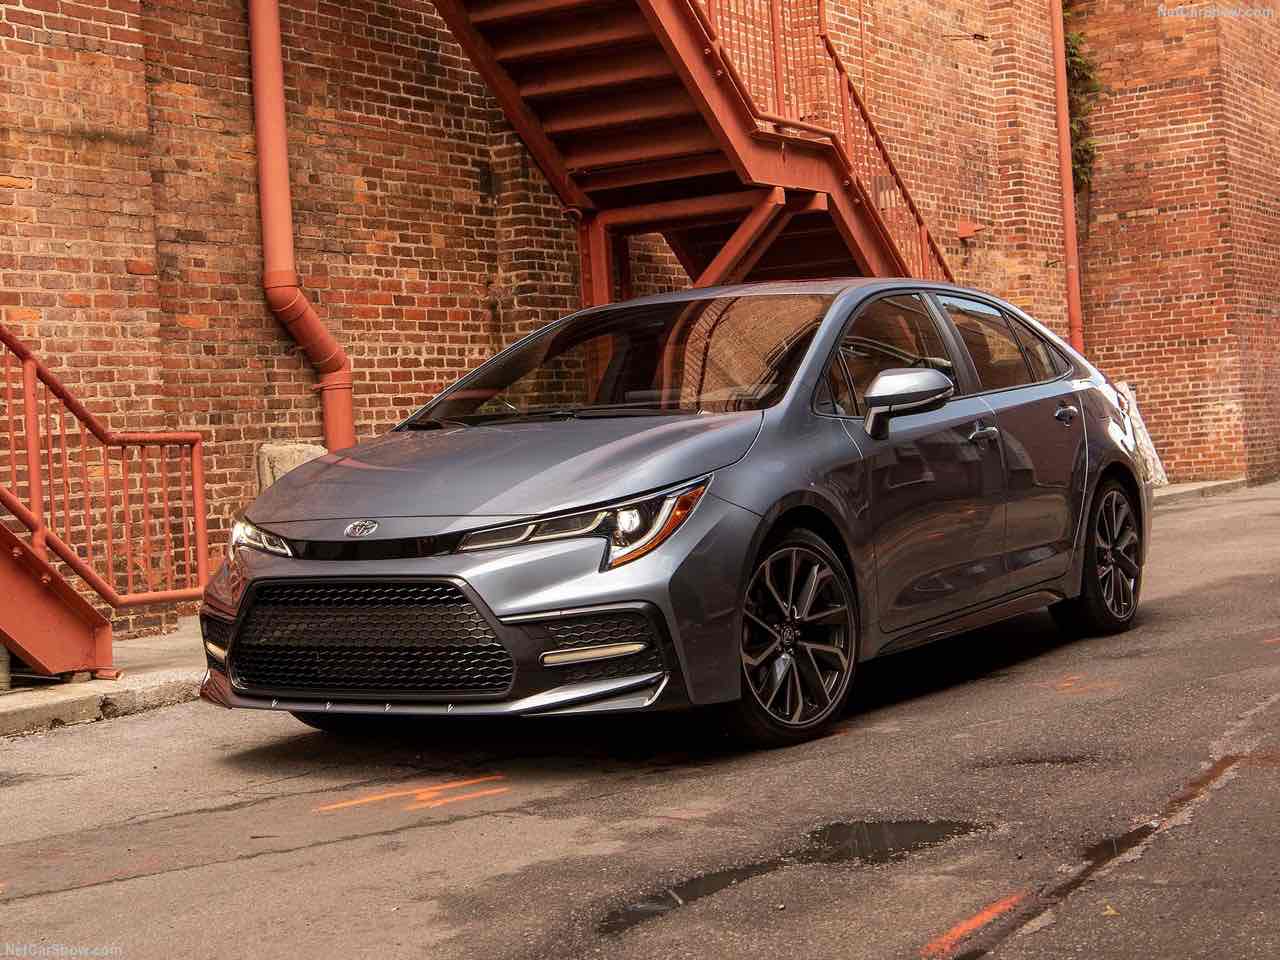
Pakistani Vehicles Sales in 2019 has sharply declined, falling at the lowest volume since 2014. Indeed, the Full-year ended at 186.588 units sold, losing 26.8% from the previous year. Suzuki held almost 57.3% of share, while Honda has crumbled down 42.6%.
Economic Environment
Pakistani economy likely remained weak in the first quarter of FY 2020, which ran from July to September. Large-scale manufacturing contracted at a sharper rate in Q1 than in the previous quarter, while higher electricity tariffs also likely depressed household spending. Turning to the second quarter, the current account balance posted a surplus in October for the first time in roughly four years, partly thanks to stronger exports, boding well for the external sector. That said, a dip in consumer confidence and elevated inflation will likely constrain consumer spending.
Growth is projected to decelerate in FY 2020, dragged by slowing private consumption due to higher taxes and tight monetary conditions. In addition, weak public finances and tensions with India pose downside risks to the outlook.
Market Trend
Pakistani vehicles market in recent years has reacted promptly to the 2013 fall with sales improved from 140.732 (2013) to a record of 226.141 (2015) before to decline at 208.998 in the 2016. In the 2017 the market was sustained by a robust internal demand, hitting another record at 247.330 (+18.3%).
In 2018 the market kept momentum improving from the previous year, incresing sales by 6.9% with 264.442 units sold. Moreover, this was the first time the Pakistani market crossed the quarter-million annual sales.
In 2019, according to data released by the Pakistani Automotive Manufacturers Association, the market has imploded due to a tax introduction, making new car imports negligible. Indeed, the Full-year ended at 186.588 units sold, losing 26.8% from the previous year.
The competitive landscape sees the market leader Suzuki still on top, holding 57.3% of the market, after keeping a stable share during the last decade
Behind, Toyota – losing almost 5 points of market share from 2010 – ended in second place, followed by the worst brand of the year, Honda, which has instead grown from 10.4% in 2010 to 14.4%.
Tables with sales figures
In the tables below we report sales for all Brands, top 10 Manufacturers Group and top 10 Models.


