Portuguese Auto Market kept momentum int he 2017 improving 7.1% at the best level in a decade. Renault runs fast on top of the competitive arena gaining the race for leadership over Peugeot and Volkswagen.
Portuguese economy is experiencing a momentous turnaround. Quarter-on-quarter growth in Q3 was confirmed at 0.5%, up from 0.3% in Q2. A rebound in private consumption, bolstered by positive consumer confidence and the ongoing recovery in the labor market, was behind Q3’s higher print. Although confidence among households fell in November from October’s record high, overall economic sentiment in the month remained strong and points to a solid economic performance in the final quarter. A critical turning point in Portugal’s recovery from the debt crisis that brought it to the brink of default five years ago came on 15 December, when Fitch Ratings upgraded the nation’s credit rating by two notches.
Portuguese vehicles market was hit by a huge crisis in the 2008 losing 75% of volume. However, since 2012 a strong recovery is in place and in the last five years car passenger’s sales doubled from 95.000 in the 2012 to 207.315 in the 2016. The momentum is still in place and the 2017 ended with over 220.000 sales, up 7.1% and the run will continue during the 2018.
| Sales 2012 | Sales 2013 | Sales 2014 | Sales 2015 | Sales 2016 | Sales 2017 e | Sales 2018 e | |
|---|---|---|---|---|---|---|---|
| Car | 95.290 | 105.907 | 142.826 | 178.503 | 207.315 | 222.060 | 230.921 |
| LCV | 14.039 | 18.224 | 26.262 | 30.809 | 33.682 | 38.604 | 40.143 |
| Total | 109.329 | 124.131 | 169.088 | 209.312 | 240.997 | 260.664 | 271.064 |
| 2012 Var | 2013 Var | 2014 Var | 2015 Var | 2016 Var | 2017 Var e. | 2018 var e | |
|---|---|---|---|---|---|---|---|
| Car | -37,9% | 11,1% | 34,9% | 25,0% | 16,1% | 7,1% | 4,0% |
| LCV | -59,8% | 29,8% | 44,1% | 17,3% | 9,3% | 14,6% | 4,0% |
| Total | -41,9% | 13,5% | 36,2% | 23,8% | 15,1% | 8,2% | 4,0% |
According to data released by the A.C.A.P., the Portuguese Association of Car Producers, in the Q1 sales grew only 2.5%, before to accelerate in Q2 ending the first half at 127.179 units, up 7.2%. In the Q3 sales improved 8.4%. In October sales have been 15.898 (+6.4%), in November 17.629 (+6.7%) and in December 17.058 (+0.4%) with full year figures at 222.060, up 7.1%.
Renault triumphed on top of the market with a wide gap over the more immediate challengers, selling 30.112 cars (+16.4%).
In second place Peugeot with 21.104 units (+6.3%) andin third Volkswagen, with 16.473 (-3.3%).
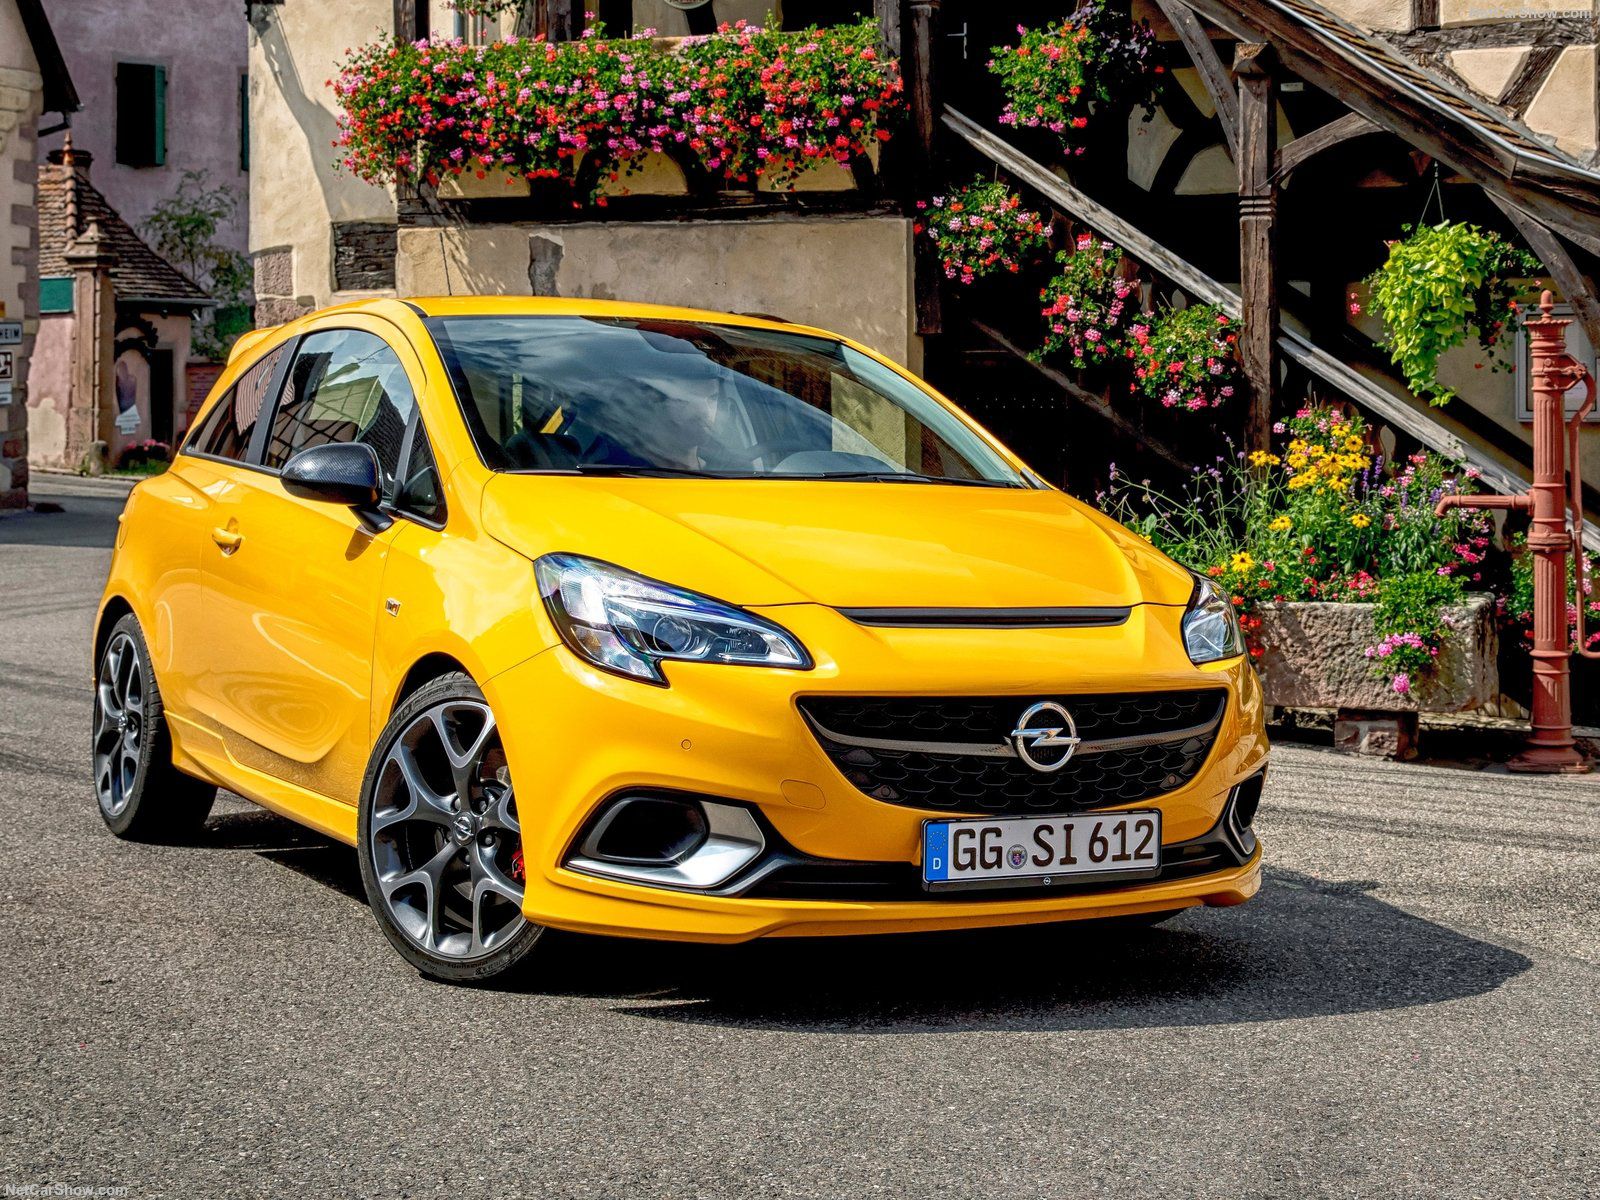
In fourth place Mercedes with 16.276 sales (+6.3%) followed by BMW with 14.524 (+1.9%), Opel with 13.186 (+9.3%), Nissan with 12.976 units (+10.8%), Fiat with 12.025 (+18.2%) and Citroen with 10.782 sales (+8.8%).
As Annual Member you are entitled to see the best-selling cars ranking reports.
Research, Consulting, Data & Forecast
F2M covers intensively this market with several products developed to help any investigation required. Market Researches in PDF are immediately available for download with study on the market since 2005 and with forecast up to the 2025. AutoData in EXCEL are immediately downloadable with annual sales volume, split by month, for all brands and all models distributed in the market. This year data are released year to date, but you will receive a monthly update until the year-end. See details within Portugal Corner Store.
| Rank 2017 | Ran Dec | Brand | Sales 2017 | Sales Dec | Variation Dec | Variation 2017 | Share 2017 | Share Dec |
|---|---|---|---|---|---|---|---|---|
| 1 | 1 | Renault | 30.112 | 2.215 | -11,1% | 16,4% | 13,6% | 13,0% |
| 2 | 2 | Peugeot | 21.104 | 1.587 | -10,0% | 6,3% | 9,5% | 9,3% |
| 3 | 3 | Volkswagen | 16.473 | 1.208 | 8,7% | -3,3% | 7,4% | 7,1% |
| 4 | 6 | Mercedes | 16.276 | 1.044 | 5,1% | 6,3% | 7,3% | 6,1% |
| 5 | 4 | BMW | 14.524 | 1.149 | 46,6% | 1,9% | 6,5% | 6,7% |
| 6 | 8 | Opel | 13.186 | 954 | -10,7% | 9,3% | 5,9% | 5,6% |
| 7 | 5 | Nissan | 12.976 | 1.140 | 2,5% | 10,8% | 5,8% | 6,7% |
| 8 | 9 | Fiat | 12.025 | 762 | 8,9% | 18,2% | 5,4% | 4,5% |
| 9 | 11 | Citroen | 10.782 | 721 | -5,6% | 8,8% | 4,9% | 4,2% |
| 10 | 7 | Audi | 9.613 | 1.028 | 8,9% | 1,2% | 4,3% | 6,0% |
| 11 | 13 | Ford | 8.761 | 666 | 16,8% | 7,5% | 3,9% | 3,9% |
| 12 | 10 | Toyota | 8.528 | 733 | -26,1% | 1,5% | 3,8% | 4,3% |
| 13 | 14 | Seat | 8.234 | 563 | -10,6% | -1,0% | 3,7% | 3,3% |
| 14 | 12 | Dacia | 6.612 | 706 | 27,9% | 22,1% | 3,0% | 4,1% |
| 15 | 16 | Kia | 5.489 | 353 | 18,9% | 13,3% | 2,5% | 2,1% |
| 16 | 15 | Volvo | 4.605 | 543 | 6,5% | 5,5% | 2,1% | 3,2% |
| 17 | 17 | Hyundai | 3.476 | 349 | 68,6% | 37,2% | 1,6% | 2,0% |
| 18 | 18 | Smart | 3.126 | 225 | -4,7% | 3,0% | 1,4% | 1,3% |
| 19 | 20 | Mini | 2.798 | 184 | -1,6% | 7,6% | 1,3% | 1,1% |
| 20 | 19 | Mazda | 2.765 | 200 | -7,8% | 5,7% | 1,2% | 1,2% |
| 21 | 21 | Skoda | 2.280 | 180 | -23,7% | -20,8% | 1,0% | 1,1% |
| 22 | 23 | Mitsubishi | 2.127 | 114 | -16,2% | -2,8% | 1,0% | 0,7% |
| 23 | 22 | Honda | 1.498 | 137 | -22,2% | -33,9% | 0,7% | 0,8% |
| 24 | 25 | Land Rover | 1.035 | 46 | -31,3% | 9,6% | 0,5% | 0,3% |
| 25 | 28 | Alfa Romeo | 888 | 40 | -44,4% | 24,2% | 0,4% | 0,2% |
| 26 | 29 | Jaguar | 697 | 38 | -5,0% | 10,3% | 0,3% | 0,2% |
| 27 | 24 | DS | 647 | 47 | -4,1% | -9,3% | 0,3% | 0,3% |
| 28 | 27 | Lexus | 453 | 41 | 32,3% | 21,8% | 0,2% | 0,2% |
| 29 | 26 | Suzuki | 423 | 42 | 35,5% | 66,5% | 0,2% | 0,2% |
| 30 | 30 | Jeep | 236 | 25 | 212,5% | 37,2% | 0,1% | 0,1% |
| 31 | 31 | Porsche | 207 | 11 | 37,5% | 56,8% | 0,1% | 0,1% |
| 32 | 33 | Maserati | 52 | 1 | ||||
| 33 | 33 | Ferrari | 20 | 1 | ||||
| 34 | 32 | Aston Martin | 16 | 4 | ||||
| 35 | 33 | Bentley | 10 | 1 |
| Rank 2017 | Ran Dec | Group | Sales 2017 | Sales Dec | Variation Dec | Variation 2017 | Share 2017 | Share Dec |
|---|---|---|---|---|---|---|---|---|
| 1 | 1 | Renault Nissan Alliance | 51.827 | 4.175 | -2,7% | 14,7% | 23,3% | 24,5% |
| 2 | 2 | P.S.A. | 45.719 | 3.309 | -9,2% | 7,5% | 20,6% | 19,4% |
| 3 | 3 | Volkswagen Group | 36.821 | 2.991 | 2,1% | -2,8% | 16,6% | 17,5% |
| 4 | 5 | Mercedes Benz | 19.402 | 1.269 | 3,3% | 5,8% | 8,7% | 7,4% |
| 5 | 4 | BMW | 17.322 | 1.333 | 37,3% | 2,8% | 7,8% | 7,8% |
| 6 | 6 | F.C.A. | 13.223 | 829 | 5,7% | 18,5% | 6,0% | 4,9% |
| 7 | 7 | Toyota M.C. | 8.981 | 774 | -24,3% | 2,4% | 4,0% | 4,5% |
| 8 | 8 | Hyundai-Kia | 8.965 | 702 | 39,3% | 21,5% | 4,0% | 4,1% |
| 9 | 9 | Ford M.C. | 8.761 | 666 | 16,8% | 7,5% | 3,9% | 3,9% |
| 10 | 10 | Geely Group | 4.605 | 543 | 6,5% | 5,4% | 2,1% | 3,2% |


