Serbia Auto Sales 2016 up double-digit keeping the recovery after the 2009 shortfall. Fiat led ahead of Skoda and Volkswagen thanks to the high demand on the local made 500L.
Market Outlook
In December, delegates from the IMF successfully completed the latest review of the Serbian economy, highlighting the significant progress made with fiscal consolidation during 2016. FocusEconomics panelists project that GDP will expand 2.8% in 2017, which is up 0.2 percentage points from last month’s estimate.
The domestic vehicles market in 2016 posted for the second consecutive year a double digit increase, scoring 25.334 registrations (+16.9%). It was the best sales level since 2012, however this performance is still far from the all time record with over 44.000 units established in 2008.
The vehicles passengers in December had been 2.467 (+19.5%).
Competitive Arena
Fiat was the leader of the year with 4.336 units (+17.9%) ahead of Skoda with 3.761 (+0.3%) and Volkswagen with 2.188 (+13.9%). Among the greatest increases were reported for Peugeot, Renault, Opel, Citroen, Dacia and Nissan, while Seat and Hyundai boomed surging 392.0% and 200.9%.
Mitsubishi fell down losing 18.8%, followed by Kia, Mazda and Jeep.
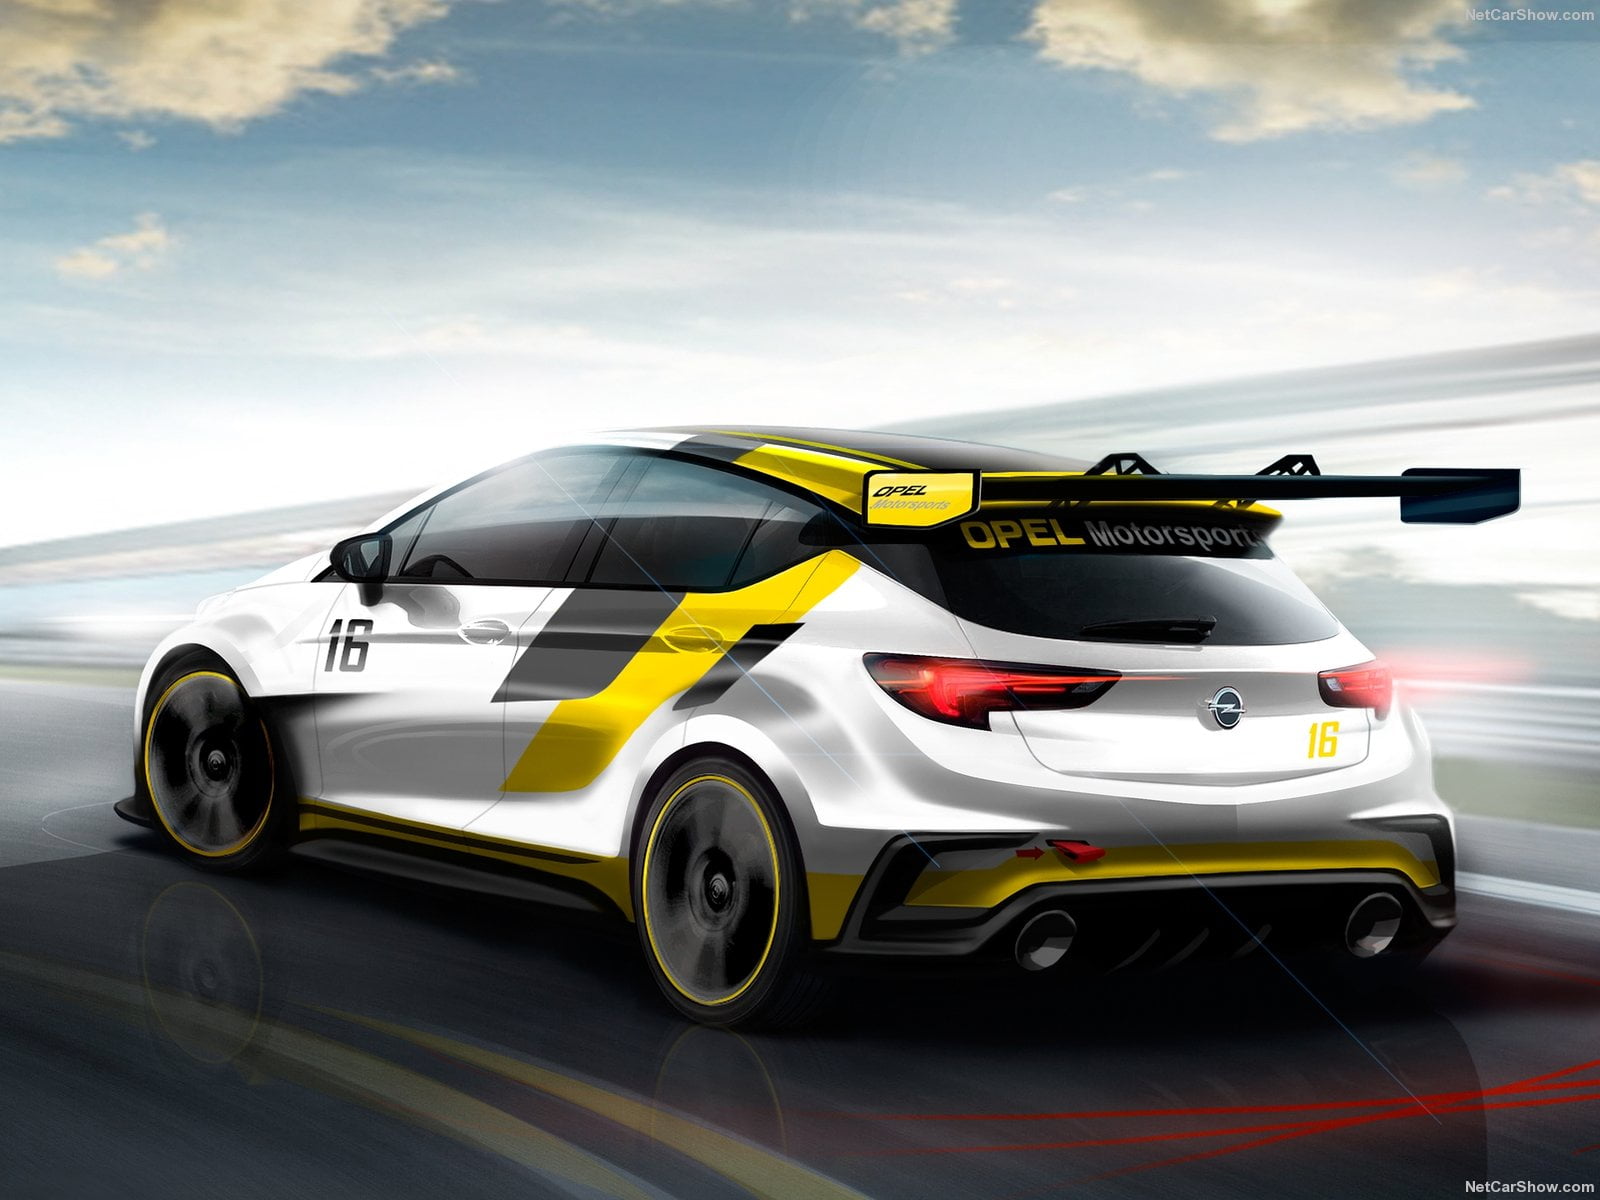
Assembled locally in the Kragujevac Fiat factory, the Fiat 500L kept the leadership for the second consecutive year with 1.709 sales (+0.6%) ahead of the Skoda Octavia with 1.219 (+8.0%) and the Opel Astra with 883 (+54.9%).
Below, you can sort our interactive tables to see data regarding Brands, Groups and Models. Please bear in mind that sales data are subject to adjustments as sources will update their information. This report is updated at the publishing date and will not be modified while the next on this subject will always have the year to date data updated.
| Rank Dec | Rank 2016 | BRAND | Sales December | Sales 2016 FY | Variation December | Variation 2016 FY | Share December | Share 2016 |
|---|---|---|---|---|---|---|---|---|
| 2 | 1 | Fiat | 410 | 4.336 | 6,5% | 17,9% | 16,6% | 16,4% |
| 1 | 2 | Skoda | 439 | 3.761 | 13,4% | 0,3% | 17,8% | 14,2% |
| 7 | 3 | Volkswagen | 130 | 2.188 | 25,0% | 13,9% | 5,3% | 8,3% |
| 5 | 4 | Renault | 160 | 2.082 | 88,2% | 65,2% | 6,5% | 7,9% |
| 4 | 5 | Opel | 191 | 1.891 | 16,5% | 29,2% | 7,7% | 7,2% |
| 6 | 6 | Dacia | 153 | 1.684 | 37,8% | 21,5% | 6,2% | 6,4% |
| 3 | 7 | Ford | 242 | 1.623 | 38,3% | 6,6% | 9,8% | 6,1% |
| 11 | 8 | Hyundai | 58 | 1.610 | -50,0% | 200,9% | 2,4% | 6,1% |
| 9 | 9 | Toyota | 80 | 1.093 | 9,6% | 5,0% | 3,2% | 4,1% |
| 11 | 10 | Kia | 58 | 722 | -9,4% | -18,8% | 2,4% | 2,7% |
| 8 | 11 | Audi | 82 | 686 | 46,4% | 8,5% | 3,3% | 2,6% |
| 10 | 12 | Peugeot | 67 | 634 | 9,8% | 65,5% | 2,7% | 2,4% |
| 9 | 13 | Mercedes | 80 | 582 | 3,2% | 2,2% | ||
| 12 | 14 | Citroen | 53 | 549 | 12,8% | 27,4% | 2,1% | 2,1% |
| 16 | 15 | BMW | 28 | 463 | -39,1% | 14,3% | 1,1% | 1,8% |
| 13 | 16 | Nissan | 48 | 457 | 33,3% | 14,5% | 1,9% | 1,7% |
| 14 | 17 | Suzuki | 40 | 429 | 81,8% | 10,6% | 1,6% | 1,6% |
| 15 | 17 | Mazda | 31 | 429 | -16,2% | -14,4% | 1,3% | 1,6% |
| 18 | 18 | Honda | 16 | 235 | 77,8% | 1,7% | 0,6% | 0,9% |
| 17 | 19 | Jeep | 21 | 199 | 5,0% | -13,1% | 0,9% | 0,8% |
| 19 | 20 | Seat | 15 | 123 | 650,0% | 392,0% | 0,6% | 0,5% |
| 24 | 21 | Land Rover | 4 | 116 | -82,6% | -6,5% | 0,2% | 0,4% |
| 20 | 22 | Volvo | 13 | 107 | 116,7% | 42,7% | 0,5% | 0,4% |
| 21 | 23 | Porsche | 11 | 103 | 175,0% | 37,3% | 0,4% | 0,4% |
| 22 | 24 | Alfa Romeo | 10 | 82 | 66,7% | 46,4% | 0,4% | 0,3% |
| 23 | 25 | Mitsubishi | 5 | 80 | -70,6% | -28,6% | 0,2% | 0,3% |
| 25 | 26 | Mini | 3 | 53 | -25,0% | -8,6% | 0,1% | 0,2% |
| 26 | 27 | Great Wall | 2 | 33 | 100,0% | -37,7% | 0,1% | 0,1% |
| 26 | 28 | Subaru | 2 | 27 | -33,3% | 8,0% | 0,1% | 0,1% |
| 26 | 29 | GAZ | 2 | 23 | 0,1% | 0,1% | ||
| 20 | 30 | Jaguar | 13 | 20 | 0,5% | 0,1% | ||
| 27 | 31 | Infiniti | - | 14 | -100,0% | 27,3% | 0,0% | 0,1% |
| Rank Dec | Rank 2016 | GROUP | Sales December | Sales 2016 FY | Variation December | Variation 2016 FY | Share December | Share 2016 FY |
|---|---|---|---|---|---|---|---|---|
| 1 | 1 | Volkswagen | 677 | 6.861 | 22,4% | 7,2% | 27,4% | 26,0% |
| 2 | 2 | FCA | 441 | 4.617 | 7,3% | 16,5% | 17,9% | 17,5% |
| 3 | 3 | Renault-Nissan | 361 | 4.237 | 54,9% | 38,1% | 14,6% | 16,0% |
| 7 | 4 | Hyundai-Kia | 116 | 2.332 | -35,6% | 63,8% | 4,7% | 8,8% |
| 5 | 5 | General Motors | 191 | 1.891 | 16,5% | 29,2% | 7,7% | 7,2% |
| 4 | 6 | Ford | 242 | 1.623 | 38,3% | 6,6% | 9,8% | 6,1% |
| 6 | 7 | PSA | 120 | 1.183 | 11,1% | 45,3% | 4,9% | 4,5% |
| 8 | 8 | Toyota | 80 | 1.093 | 9,6% | 5,0% | 3,2% | 4,1% |
| 8 | 9 | Mercedes Daimler | 80 | 582 | 3,2% | 2,2% | ||
| 10 | 10 | BMW | 31 | 516 | -38,0% | 11,4% | 1,3% | 2,0% |
| Rank Dec | Rank 2016 | Model | Sales December | Sales 2016 | Variation December | Variation 2016 |
|---|---|---|---|---|---|---|
| 2 | 1 | Fiat 500L | 186 | 1.709 | -17,0% | -6,0% |
| 14 | 2 | Skoda Octavia | 3 | 1.219 | -97,5% | 8,0% |
| 5 | 3 | Opel Astra | 86 | 883 | -26,5% | 54,9% |
| 6 | 4 | Skoda Fabia | 81 | 829 | -44,1% | -30,6% |
| 10 | 5 | Dacia Sandero | 46 | 805 | -20,7% | 26,0% |
| 3 | 6 | Ford Fiesta | 119 | 720 | 40,0% | 15,9% |
| 4 | 7 | Skoda Superb | 88 | 665 | 79,6% | 29,9% |
| 13 | 8 | Hyundai i30 | 17 | 617 | -15,0% | 210,1% |
| 11 | 9 | Renault Clio | 32 | 616 | -15,8% | 25,5% |
| 12 | 10 | Hyundai Tucson | 24 | 612 | -40,0% | 316,3% |
| 1 | 11 | Skoda Rapid | 188 | 575 | 241,8% | -47,0% |


