Ugandan vehicles market has further lost terrain during the 2017, albeit improved economic and business conditions. The absence of legislation to limit the import of very old used vehicles stops any stable new vehicles market development opportunity.
Uganda’s economic activity expanded at the fastest clip since May in October, and indicators for November seem to indicate another solid month. The PMI increased for the 10th consecutive month, signaling ongoing growth in Uganda’s private sector economy. It came mainly on the back of growth in output, new orders and employment. New orders and output are likely to pick up further in the coming months as the political deadlock in Kenya, a crucial trading partner for Uganda, comes to an end. Business confidence also increased in November, but access to credit remained tight.
New vehicles market continues to decline and after the record scored in the 2015, this year will be the second in a row declining. Indeed, the market is still really limited, representing only a marginal quota on the import of vehicles, and there are no signs of Government actions to limit the import of exhaust and obsolete used-vehicles. Additionally, improved economic environment is not enough to sustain private consumer demand, considering the very low pro capita income.
In the 2017, total vehicles sales have been 2.193 (-8.9%)
| Sales 2012 | Sales 2013 | Sales 2014 | Sales 2015 | Sales 2016 | Sales 2017 | Sales 2018 e | |
|---|---|---|---|---|---|---|---|
| Car+LCV | 1.961 | 2.293 | 1.911 | 2.459 | 2.148 | 1.858 | 1.749 |
| HCV | 211 | 217 | 55 | 332 | 275 | 325 | 377 |
| Total | 2.172 | 2.510 | 1.966 | 2.791 | 2.423 | 2.183 | 2.126 |
| 2012 Var | 2013 Var | 2014 Var | 2015 Var | 2016 Var | 2017 Var | 2018 var e | |
|---|---|---|---|---|---|---|---|
| Car+LCV | 3,6% | 16,9% | -16,7% | 28,7% | -12,6% | -13,5% | -5,9% |
| HCV | -17,3% | 2,8% | -74,7% | 503,6% | -17,2% | 18,2% | 16,0% |
| Total | 1,1% | 15,6% | -21,7% | 42,0% | -13,2% | -9,9% | -2,6% |
2018 Outlook is positive and it is expected a market recovery in the range of 15-20%.
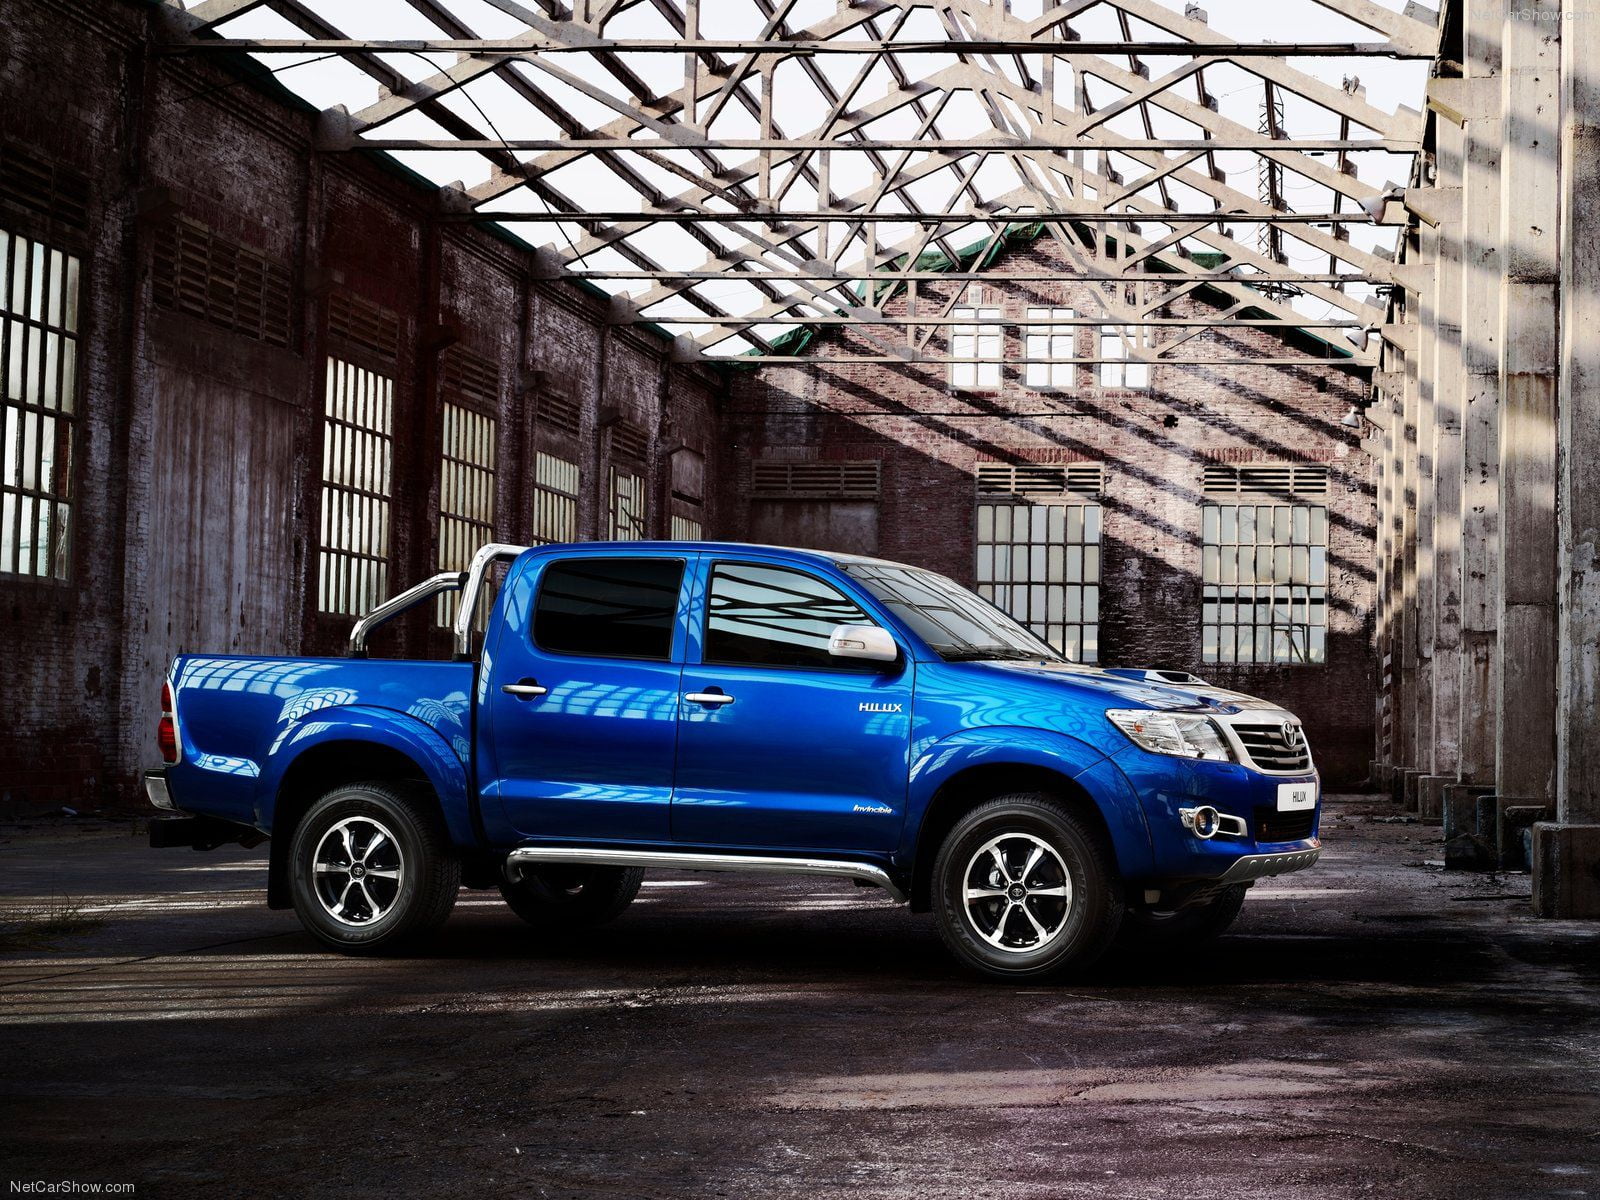
Market leader is – of course – Toyota with 39.7% of market share (including all vehicles) ahead of Nissan and Tata (leader for the Heavy Truck and Bus segment).


