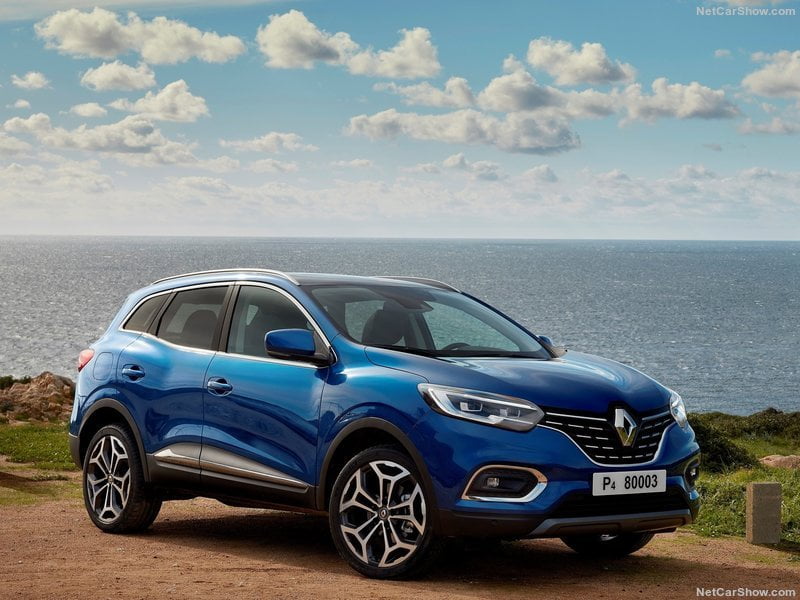
Ukrainian Cars market in 2019 immediately recovered from the previous year’s drop. Indeed, the year ended with Total sales at 88.335 (+7.9%). Renault was the new market leader – with 16.5% of share – ahead of Toyota and Kia.
Economic Environment
Market Trend
Ukrainian vehicles market has been hit both by economic and political crisis falling down at near one-tenth of the record level (over 600.000 sales) achieved over a decade ago. The negative peak was hit in 2016, with only 65.516 units sold. Then, the market registered a sign of recovery in 2017 with 82.729 units. However, sales went down 2.4% again in 2018 at 80.742.
In 2019, according to the data released by the Ukranian Association of Automobile Manufacturers, immediately recovered from the previous year’s drop. Indeed, the year ended with Total sales at 88.335 (+7.9%).
In the competitive landscape, after several years in where Toyota played as a protagonist, the Ukranian market is now having a new market leader. Indeed, Renault is currently on top of the ranking, soaring at 67.4%. Renault’s market share registered an astonishing growth during the last decade, moving from 3.4% in 2010 to 16.5%.
Despite losing the market crown, the former leader Toyota is growing in double-digits (+24.7%), holding 14.2% of market share.
Behind, Kia conquered the podium – growing over 2.5 points of market share in just a year – ahead of Skoda and Nissan, which held respectively 7.1% and 6% of share.
Service Solutions
Since 2010, focus2move.com is a specialist in the automotive industry tracking monthly sales for all brands and models in the widest in the World range of countries, actually over 150. From this huge database we can extract data sorted under your own conditions and deliver historical data in excel.
If you like to receive historical data or to subscribe at monthly update, contact us at kventura@focus2move.com and we will arrange a short video call. By showing you our database and segmentation, we can find together the best solutions for your team.
| Rank 2019 | Rank 2018 | Brand | Sales YTD 2019 | Sales December | +/- YTD 2019 | Share 2019 | Share December |
|---|---|---|---|---|---|---|---|
| 1 | 2 | Renault | 14.603 | 806 | 67,4% | 16,53% | 11,50% |
| 2 | 1 | Toyota | 12.570 | 789 | 24,7% | 14,23% | 11,25% |
| 3 | 7 | Kia | 7.586 | 575 | 55,4% | 8,59% | 8,20% |
| 4 | 5 | Skoda | 6.231 | 501 | 15,3% | 7,05% | 7,15% |
| 5 | 4 | Nissan | 5.333 | 476 | -3,7% | 6,04% | 6,79% |
| 6 | 6 | Hyundai | 5.099 | 420 | 2,4% | 5,77% | 5,99% |
| 7 | 3 | Volkswagen | 4.675 | 402 | -24,4% | 5,29% | 5,73% |
| 8 | 12 | Suzuki | 2.614 | 177 | -0,2% | 2,96% | 2,52% |
| 9 | 9 | Mazda | 2.483 | 236 | -20,6% | 2,81% | 3,37% |
| 10 | 13 | Peugeot | 2.366 | 174 | 7,5% | 2,68% | 2,48% |
| 11 | 15 | BMW | 2.342 | 187 | 9,0% | 2,65% | 2,67% |
| 12 | 14 | Mitsubishi | 2.288 | 245 | 4,2% | 2,59% | 3,49% |
| 13 | 11 | Mercedes | 2.165 | 239 | -18,4% | 2,45% | 3,41% |
| 14 | 8 | Ford | 1.727 | 216 | -44,8% | 1,96% | 3,08% |
| 15 | 16 | Lexus | 1.677 | 127 | 7,3% | 1,90% | 1,81% |
| 16 | 17 | Citroen | 1.676 | 99 | 17,3% | 1,90% | 1,41% |
| 17 | 19 | Chery | 1.672 | 94 | 38,5% | 1,89% | 1,34% |
| 18 | 10 | Audi | 1.594 | 265 | -45,4% | 1,80% | 3,78% |
| 19 | 21 | Fiat | 1.249 | 108 | 37,1% | 1,41% | 1,54% |
| 20 | 24 | Volvo | 1.090 | 102 | 43,8% | 1,23% | 1,45% |
| 20 | 23 | Land Rover | 1.090 | 86 | 39,6% | 1,23% | 1,23% |
| 21 | 30 | Seat | 790 | 19 | 122,5% | 0,89% | 0,27% |
| 22 | 22 | Subaru | 710 | 115 | -20,2% | 0,80% | 1,64% |
| 23 | 26 | Lada | 686 | 50 | 19,7% | 0,78% | 0,71% |
| 24 | 27 | Porsche | 573 | 59 | 0,7% | 0,65% | 0,84% |
| 25 | 20 | Honda | 525 | 109 | -46,0% | 0,59% | 1,55% |
| 26 | 39 | Haval | 434 | 83 | 675,0% | 0,49% | 1,18% |
| 27 | 35 | Opel | 374 | 12 | 78,9% | 0,42% | 0,17% |
| 28 | 36 | Jaguar | 338 | 40 | 62,5% | 0,38% | 0,57% |
| 29 | 29 | Infiniti | 324 | 39 | -27,2% | 0,37% | 0,56% |
| 30 | 33 | JAC | 278 | 25 | 17,8% | 0,31% | 0,36% |
| 31 | 25 | Chevrolet | 255 | 41 | -60,0% | 0,29% | 0,58% |
| 32 | 18 | Ravon | 208 | 3 | -83,9% | 0,24% | 0,04% |
| 33 | 37 | Jeep | 175 | 24 | 2,3% | 0,20% | 0,34% |
| 34 | 32 | Great Wall | 108 | 6 | -64,1% | 0,12% | 0,09% |
| 35 | 38 | Mini | 106 | 10 | -29,3% | 0,12% | 0,14% |
| 36 | 34 | Tesla | 102 | 31 | -52,1% | 0,12% | 0,44% |
| 37 | 31 | Geely | 56 | - | -84,2% | 0,06% | 0,00% |
| 38 | 41 | Bentley | 36 | 6 | -5,3% | 0,04% | 0,09% |
| 39 | 45 | Alfa Romeo | 35 | 3 | 75,0% | 0,04% | 0,04% |
| 40 | 40 | Maserati | 24 | 1 | -40,0% | 0,03% | 0,01% |
| 41 | 50 | Rolls-Royce | 14 | 1 | 366,7% | 0,02% | 0,01% |
| 42 | 46 | Acura | 10 | 3 | -47,4% | 0,01% | 0,04% |
| 43 | 43 | UAZ | 8 | 1 | -69,2% | 0,01% | 0,01% |
| 44 | 49 | Dodge | 7 | - | 16,7% | 0,01% | 0,00% |
| 44 | 42 | Smart | 7 | 3 | -81,1% | 0,01% | 0,04% |
| 45 | 44 | Lincoln | 5 | - | -76,2% | 0,01% | 0,00% |
| 45 | 47 | Buick | 5 | 1 | -64,3% | 0,01% | 0,01% |
| 46 | 48 | Cadillac | 4 | 1 | -55,6% | 0,00% | 0,01% |
| 47 | 50 | Aston Martin | 3 | - | 0,0% | 0,00% | 0,00% |
| 48 | 28 | ZAZ | 2 | - | -99,6% | 0,00% | 0,00% |
| 48 | 51 | Chrysler | 2 | - | 0,00% | 0,00% | |
| 49 | 48 | GMC | 1 | 1 | -88,9% | 0,00% | 0,01% |
| Rank 2019 | Rank 2018 | Group | Sales YTD 2019 | Sales December | +/- YTD 2019 | Share 2019 | Share December |
|---|---|---|---|---|---|---|---|
| 1 | 1 | Renault Nissan Alliance | 23.234 | 1616 | 33,0% | 26,35% | 23,05% |
| 2 | 3 | Toyota Group | 14.247 | 916 | 22,3% | 16,15% | 13,07% |
| 3 | 2 | Volkswagen Group | 13.899 | 1252 | -10,1% | 15,76% | 17,86% |
| 4 | 4 | Hyundai-Kia | 12.685 | 995 | 28,7% | 14,38% | 14,19% |
| 5 | 5 | P.S.A. | 4.416 | 285 | 15,1% | 5,01% | 4,07% |
| 6 | 9 | Suzuki | 2.614 | 177 | -0,2% | 2,96% | 2,52% |
| 7 | 7 | Mazda | 2.483 | 236 | -20,6% | 2,82% | 3,37% |
| 8 | 10 | BMW | 2.462 | 198 | 7,0% | 2,79% | 2,82% |
| 9 | 8 | Mercedes Daimler | 2.172 | 242 | -19,3% | 2,46% | 3,45% |
| 10 | 6 | Ford Group | 1.732 | 216 | -45,0% | 1,96% | 3,08% |
| Rank 2019 | Rank 2018 | Model | YTD 2019 | YTD 2019 Var | December Sales | December var |
|---|---|---|---|---|---|---|
| 1 | 2 | Kia Sportage | 6.027 | 92,7% | 579 | 38,5% |
| 2 | 1 | Renault Duster | 5.202 | 50,1% | 569 | 44,8% |
| 3 | 5 | Renault Logan | 4.489 | 88,2% | 467 | 135,9% |
| 4 | 3 | Toyota RAV4 | 4.227 | 59,3% | 455 | 247,3% |
| 5 | 12 | Renault Sandero | 3.246 | 105,3% | 451 | 252,3% |
| 6 | 8 | Skoda Octavia | 2.852 | 33,4% | 383 | 85,9% |
| 7 | 15 | Toyota Prado | 2.671 | 98,0% | 392 | 226,7% |
| 8 | 6 | Hyundai Tucson | 2.558 | 14,8% | 262 | 20,2% |
| 9 | 7 | Nissan Qashqai | 2.112 | -3,9% | 188 | -4,6% |
| 10 | 4 | Toyota Camry | 1.835 | -23,7% | 160 | -20,0% |


