World Car Group Ranking 2016 crowns the Volkswagen Group as the global leader, improving sales at their new all time record despite pessimistic forecast at the start of the year.
The battle for the leadership
Twelve months ago, just few observers could have predicted the final 2016 sales ranking. Indeed, the scandal on emission level raised over Volkswagen Group in the fall of 2015 seemed to kick hardly over the German Group, having to pay a huge tribute in both financially and in sales terms.
However, while the financial cost had been high while below the original forecast, under sales level the group managed to handle the scandal effects market by market with an astonishing year-end results, with global sales for cars and lcvs even better than last year.
Indeed, in the full year 2016 Volkswagen Group light vehicles sales (actually preliminary) hit the all time record with 10.1 million global sales and 11.1% of market share, up 1.4% from the 2015.
At the same time, the former leader, Toyota, was not able to take advantage closing the year up only 0.2% with 9.94 million sales, losing the leadership.
The battle for the podium
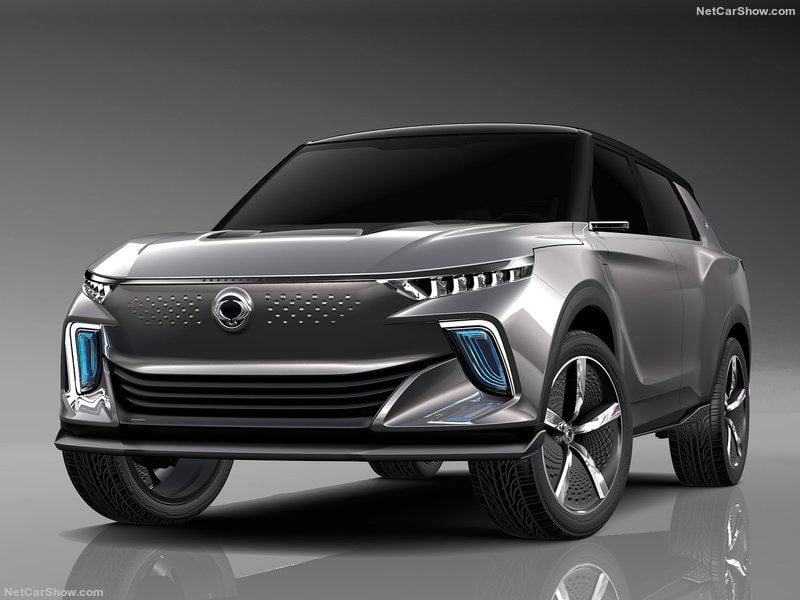
Renault-Nissan Alliance consolidated the third step of the podium with sales at 8.51 million, up a significant 6.2%, with the Korean associated, Samsung up an amazing 25.4%and Renault brand up 14.5%.
In fourth place Hyundai Group sold 8.17 million vehicles (+1.9%), gaining 8.0% in Oceania and 4.5% in Europe while losing a huge 25.1% in Africa.
General Motors Corporation (sales do not include the SAIC-Wuling-GM joint venture, reported separately) sold 7.97 million (+0.3%) and was followed by Ford Motor Company with 6.29 million (+1.7%), Honda Motor with 4.90 million (+4.8%) driven by the outstanding performance in Europe, with sales increased 21.5% and FCA with 4.86 million (+2.5%),
P.S.A. ranked 9th with 3.24 million sales (-1.0%) ahead of Suzuki with 2.85 million (+0.3%).
Data reported in this report regard only cars and light commercial vehicles. However, adding the Heavy Commercials and Bus the ranking would not change.
Below, you can sort our interactive tables to see data regarding Groups. Please bear in mind that sales data are subject to adjustments as sources will update their information. This report is updated at the publishing date and will not be modified while the next on this subject will always have the year to date data updated.
| Rank Dec | Rank 2016 | GROUP | Sales 2016 | Variation 2016 | Share 2016 |
|---|---|---|---|---|---|
| 3 | 1 | Volkswagen | 10.102.036 | 1,4% | 11,1% |
| 1 | 2 | Toyota | 9.947.416 | 0,2% | 10,9% |
| 2 | 3 | Renault-Nissan | 8.513.050 | 6,2% | 9,4% |
| 5 | 4 | Hyundai-Kia | 8.175.871 | 1,9% | 9,0% |
| 4 | 5 | General Motors | 7.972.401 | 0,3% | 8,8% |
| 6 | 6 | Ford | 6.295.636 | 1,7% | 6,9% |
| 7 | 7 | Honda | 4.906.685 | 4,7% | 5,4% |
| 8 | 8 | FCA | 4.864.390 | 2,5% | 5,4% |
| 9 | 9 | PSA | 3.248.108 | -1,0% | 3,6% |
| 10 | 10 | Suzuki | 2.855.573 | 0,3% | 3,1% |
| 12 | 11 | Mercedes Daimler | 2.449.881 | 10,0% | 2,7% |
| 11 | 12 | BMW | 2.354.577 | 3,0% | 2,6% |
| 13 | 13 | SAIC | 1.627.547 | -4,9% | 1,8% |
| 15 | 14 | Mazda | 1.511.579 | -0,3% | 1,7% |
| 19 | 15 | ChangAn | 1.368.833 | 4,0% | 1,5% |
| 14 | 16 | Geely Group | 1.203.083 | 9,2% | 1,3% |
| 16 | 17 | Dongfeng Motor | 1.045.905 | 14,3% | 1,2% |
| 17 | 18 | Mitsubishi | 1.033.685 | -9,7% | 1,1% |
| 18 | 19 | Great Wall Motors | 1.027.429 | 6,3% | 1,1% |
| 20 | 20 | Fuji Heavy Industries | 1.003.377 | 3,0% | 1,1% |
| 28 | 21 | Tata | 719.866 | 15,0% | 0,8% |
| 21 | 22 | GM-SAIC-Wuling | 685.554 | 36,3% | 0,8% |
| 25 | 23 | Chery Automobile | 617.818 | 10,0% | 0,7% |


